Business Idea
- Brand : LiveShelf
- Problem : Offline venues miss monetization opportunities because physical products seen in real life aren’t easily shoppable on the spot.
- Solution : LiveShelf enables smart tagging of physical items so customers can instantly buy anything they see in a café, hotel, or event—just by scanning with their phone.
- Differentiation : Unlike traditional QR menus or shoppable displays, LiveShelf connects offline ambiance with digital commerce through dynamic product linking, AI pricing, and spatial analytics.
- Customer : Boutique hotels, designer cafés, pop-up stores, art exhibitions, and retail-themed venues.
- Business Model : SaaS subscription + transaction fee per purchase + premium for analytics and spatial sales optimization.
- Service Region : global

1. Business Overview
1.1 Core Idea Summary
LiveShelf is a platform that transforms physical environments into shoppable spaces by enabling smart tagging of physical items, allowing visitors to instantly purchase anything they see in cafés, hotels, or events with a simple smartphone scan. The service bridges the critical gap between offline discovery and digital commerce.
This service solves the significant monetization challenge faced by venue owners who currently miss revenue opportunities when customers admire physical items but lack a frictionless way to purchase them. By leveraging spatial tagging technology, LiveShelf creates new revenue streams for venues while satisfying consumers’ impulse to buy what they experience in memorable physical spaces.
[swpm_protected for=”4″ custom_msg=’This report is available to Harvest members. Log in to read.‘]
1.2 Mission and Vision
Mission: To transform every physical space into a seamless commerce opportunity that benefits venues, brands, and consumers alike.
Vision: To create a world where any object in any space can be instantly purchasable, eliminating the boundary between inspiration and acquisition.
We aim to revolutionize the retail landscape by connecting the experiential power of physical spaces with the convenience of digital transactions, creating new revenue opportunities for venue owners while satisfying consumers’ desire for contextual, inspired purchases.
1.3 Key Products/Services Description
LiveShelf offers the following core products and services:
- SmartTag System: Proprietary technology enabling venue owners to digitally tag physical items in their spaces with invisible QR codes, NFC tags, or image recognition markers that connect to a centralized product database.
- LiveShelf Mobile App: A consumer-facing application that allows visitors to scan any tagged item within a venue, view product details, and complete purchases instantly with integrated payment processing and shipping coordination.
- Venue Management Dashboard: A comprehensive backend platform allowing venue owners to manage their product catalog, track sales performance, analyze visitor engagement patterns, and optimize product placement based on spatial analytics.
- Analytics Suite: Advanced data insights showing which products attract the most attention, optimal placement strategies, and customer behavior patterns to maximize conversion rates.
- Integration APIs: Tools that connect with existing inventory management systems, e-commerce platforms, and POS systems to ensure seamless fulfillment and inventory tracking.
These products and services create a unique ecosystem that transforms ordinary spaces into retail opportunities while maintaining the authentic ambiance that made these venues attractive in the first place.
2. Market Analysis
2.1 Problem Definition
Today’s venue owners and their visitors face several critical challenges that LiveShelf addresses:
- Monetization Gap for Experience-Driven Spaces: Design-focused venues like boutique hotels, cafés, and exhibition spaces invest heavily in curated environments but lack mechanisms to directly monetize the products that create their atmosphere. According to Hospitality Technology’s 2023 survey, 78% of boutique hotels report that guests frequently inquire about purchasing decor items, but only 12% have systems in place to facilitate these transactions.
- Lost Revenue from “Showrooming”: Physical spaces inadvertently function as unpaid showrooms when visitors discover products they like but purchase them elsewhere. Research from RetailDive indicates that 55% of consumers have photographed items in commercial spaces intending to find and purchase them later, but 67% ultimately abandon these intentions due to difficulty finding the exact products.
- Friction Between Inspiration and Purchase: The critical moment when a consumer experiences an item in context and desires to purchase it is fleeting. According to consumer behavior studies, purchase intent drops by 79% when consumers must take multiple steps or wait to complete a transaction they were inspired to make.
- Limited Data on Physical Space Engagement: Unlike online stores that track every click and interaction, physical spaces lack granular data on which items attract attention. A 2022 McKinsey retail report highlights that businesses with physical locations capture less than 15% of the customer behavior data available to online retailers.
These problems collectively result in billions in unrealized revenue for venue owners and brands, and missed opportunities for consumers to acquire products they genuinely connect with. LiveShelf bridges these gaps by creating an immediate path from physical discovery to digital purchase while generating valuable spatial engagement data.
2.2 TAM/SAM/SOM Analysis
Total Addressable Market (TAM): The global experiential retail market is valued at $918 billion according to Euromonitor International, with physical spaces that showcase sellable products representing approximately $562 billion of this total. This includes hotel retail ($64B), café/restaurant merchandise ($87B), museum/gallery shops ($42B), and other experience-driven retail environments ($369B).
Serviceable Available Market (SAM): Focusing on premium establishments in developed markets that are design-conscious and digitally forward, our SAM encompasses approximately 1.8 million venues globally, representing a $142 billion opportunity. This includes 245,000 boutique hotels, 870,000 specialty cafés and restaurants, 32,000 museums and galleries, and 650,000 pop-up and concept stores across North America, Europe, Asia-Pacific, and select urban centers elsewhere.
Serviceable Obtainable Market (SOM): Initially targeting high-end establishments in major metropolitan areas across 15 countries, our first-year SOM includes 12,500 venues representing a $380 million opportunity. By year three, we project expansion to 75,000 venues ($2.1 billion), and by year five, 220,000 venues ($6.8 billion). These projections are based on achievable penetration rates of 0.7%, 4.2%, and 12.2% of our SAM respectively.
These market size estimates are derived from industry reports by Statista, Euromonitor, and Retail Analytics, combined with proprietary research on venue density and typology in target markets. Our market entry strategy prioritizes design-conscious urban centers with high concentrations of our target venues, beginning with New York, London, Tokyo, Paris, and Los Angeles.
2.3 Market Trends
Several significant market trends support LiveShelf’s growth potential:
- Convergence of Physical and Digital Retail: The post-pandemic retail landscape is increasingly phygital (physical + digital), with 73% of retailers investing in technologies that blend in-person experiences with digital convenience. This trend is perfectly aligned with LiveShelf’s core offering and indicates growing market receptivity.
- Rise of Experiential Commerce: According to Salesforce’s 2023 Retail Trends Report, 64% of consumers now value experience over price when making purchase decisions, and businesses investing in experiential retail see 40% higher customer lifetime value. This shift supports venues that create compelling atmospheres—exactly the spaces LiveShelf serves.
- Increase in Contextual Commerce: The ability to purchase products in the context where they’re discovered is growing 34% year-over-year according to eMarketer. This directly validates LiveShelf’s core value proposition of enabling purchases at the moment of inspiration.
- Growing Importance of First-Party Data: With the decline of third-party cookies and rising privacy regulations, the value of first-party behavioral data is increasing dramatically. LiveShelf’s spatial analytics provide venues with proprietary customer behavior insights that are becoming increasingly rare and valuable.
- Adoption of Contactless Technologies: Global QR code payment users have increased by 140% since 2020, with younger demographics showing 92% familiarity with the technology. This growing comfort with scanning technologies reduces adoption barriers for LiveShelf.
- Sustainability Through Intentional Purchasing: Nielsen reports that 73% of global consumers would change consumption habits to reduce environmental impact. LiveShelf promotes intentional purchasing of items customers have experienced in person, potentially reducing return rates and associated waste.
These trends collectively support and accelerate LiveShelf’s market opportunity, as they represent fundamental shifts in consumer behavior and business priorities rather than temporary market movements.
2.4 Regulatory and Legal Considerations
LiveShelf’s operations will need to navigate several regulatory and legal considerations across global markets:
- Data Privacy Regulations: As LiveShelf collects spatial behavior data and processes customer information, compliance with GDPR in Europe, CCPA in California, and similar regulations in other jurisdictions is essential. Our system architecture must implement privacy-by-design principles, transparent data policies, and robust consent mechanisms.
- Payment Processing Regulations: Operating a platform that processes payments requires compliance with PCI DSS standards globally. Additionally, different regions have specific financial regulations governing payment processors, requiring either direct compliance or strategic partnerships with compliant processors in each market.
- Product Liability Considerations: As an intermediary connecting consumers with products, LiveShelf must carefully define the boundaries of liability for product quality, authenticity, and safety. Our terms of service will need to clearly delineate responsibilities between LiveShelf, venue owners, and product suppliers.
- Intellectual Property Rights: Our platform will need mechanisms to verify that venue owners have rights to sell the products they list, particularly for designer items that may be subject to distribution agreements or trademark protections.
- Accessibility Requirements: Digital platforms increasingly face requirements to be accessible to users with disabilities. LiveShelf will need to comply with standards like WCAG 2.1 and country-specific accessibility laws to ensure all users can benefit from our service.
- Tax Collection and Reporting: Facilitating sales across multiple jurisdictions creates complex tax obligations. Our system will need to account for varying sales tax, VAT, and GST requirements across different regions.
To address these considerations, LiveShelf will implement a comprehensive compliance framework with regular audits and updates. We’ll work with legal experts specializing in e-commerce, data privacy, and international business law to ensure our platform meets requirements across all target markets. Additionally, we’ll build flexibility into our system architecture to quickly adapt to evolving regulatory landscapes.
3. Customer Analysis
3.1 Persona Definition
LiveShelf serves two distinct customer types—venue owners who implement our platform and end consumers who use it to make purchases. Our primary focus is on venue owners as our direct customers:
Persona 1: Alex – The Boutique Hotel Manager
- Demographics: 35-45 years old, urban professional with 10+ years in hospitality management, Bachelor’s or Master’s in Hospitality Management, $85,000-120,000 income
- Characteristics: Design-conscious, early technology adopter, guest experience-focused, data-driven decision maker, active on Instagram and Pinterest
- Pain Points: Struggles to generate additional revenue beyond room bookings; frequently fields guest inquiries about furniture and decor items but has no system to facilitate purchases; lacks visibility into which design elements resonate most with guests; concerned about maintaining the hotel’s aesthetic while creating new revenue streams
- Goals: Increase revenue per guest without adding operational complexity; enhance the guest experience through innovative technologies; establish the hotel as a lifestyle brand beyond accommodation
- Purchase Decision Factors: Implementation cost vs. projected ROI; minimal disruption to current operations; aesthetic compatibility with the hotel’s design philosophy; quality of customer support and training
Persona 2: Maya – The Specialty Café Owner
- Demographics: 28-40 years old, creative entrepreneur, often with prior experience in food service or design, $60,000-90,000 income
- Characteristics: Highly design-oriented, community-focused, comfort with basic technology, active on social media, values authentic brand partnerships
- Pain Points: Limited revenue from food and beverage alone; customers frequently ask about music playing, artwork, furniture, and tableware but have no easy way to purchase; challenging to scale business without adding more locations; limited data about which elements of café atmosphere customers appreciate most
- Goals: Diversify revenue streams; build the café as a lifestyle brand; create an immersive experience that differentiates from chain competitors; foster community connections
- Purchase Decision Factors: Simplicity of implementation and management; alignment with café’s aesthetic and brand values; potential for local collaboration and customization; pricing structure that works for a small business
Persona 3: Jordan – The Exhibition Curator
- Demographics: 30-50 years old, arts/design background with 5+ years curation experience, often holds an advanced degree in art history, design, or museum studies, $70,000-110,000 income
- Characteristics: Highly detail-oriented, balances artistic integrity with commercial viability, comfortable with technology that enhances visitor experience, strong professional network
- Pain Points: Limited gift shop conversions despite high interest in exhibition pieces; difficulty tracking which displays generate most interest; cumbersome process for selling artist works; challenge quantifying exhibition impact for sponsors and stakeholders
- Goals: Support artists by creating seamless pathways to purchase; gather meaningful data about visitor engagement; extend the impact of exhibitions beyond physical visits; increase non-ticket revenue
- Purchase Decision Factors: Respect for artistic integrity; data quality and reporting capabilities; ease of integration with temporary/changing exhibitions; track record with similar cultural institutions
3.2 Customer Journey Map
The following journey map outlines how a typical venue owner experiences LiveShelf from discovery through long-term usage:
Awareness Stage:
- Customer Behavior: Researching ways to generate additional revenue; seeking technologies to enhance guest experience; networking with industry peers who may have implemented similar solutions
- Touchpoints: Industry conferences, hospitality/design publications, social media (particularly Instagram and LinkedIn), word-of-mouth from industry peers, targeted digital advertising
- Emotional State: Curious but skeptical; concerned about implementation costs and complexity; excited about new revenue potential
- Opportunity: Provide clear case studies showing ROI for similar venues; offer non-intrusive ways to learn more (webinars, downloadable guides); showcase the aesthetic quality of implementation examples
Consideration Stage:
- Customer Behavior: Comparing LiveShelf with alternative solutions; calculating potential ROI; consulting with team members about operational impact; exploring the platform through demos
- Touchpoints: Website, case studies, product demonstration, sales consultations, pricing page, implementation guides
- Emotional State: Analytical; concerned about staff adoption; hopeful about potential outcomes; nervous about making the right decision
- Opportunity: Provide transparent pricing with clear ROI calculators; offer frictionless demo experiences; connect prospects with successful customers in similar venues
Decision Stage:
- Customer Behavior: Negotiating contract terms; planning implementation timeline; preparing team for adoption; allocating budget
- Touchpoints: Sales team, contract documentation, implementation scheduling tool, initial training sessions
- Emotional State: Excited but anxious; concerned about disruption to operations; hopeful about outcomes; eager to get started quickly
- Opportunity: Streamline contracting process; provide clear implementation roadmap; offer flexible payment terms; demonstrate hands-on support availability
Usage Stage:
- Customer Behavior: Implementing the system; tagging items; training staff; monitoring initial usage data; making adjustments based on customer feedback
- Touchpoints: Implementation team, training resources, dashboard, analytics reports, customer support
- Emotional State: Initially overwhelmed during setup; satisfied when seeing first sales; frustrated by any technical difficulties; proud when receiving positive customer feedback
- Opportunity: Provide exceptional onboarding support; celebrate first wins prominently; ensure responsive troubleshooting; offer optimization suggestions based on early data
Loyalty Building:
- Customer Behavior: Expanding usage to more items; analyzing performance data to optimize placement; introducing LiveShelf to new visitors; providing testimonials
- Touchpoints: Regular performance reviews, feature updates, account management check-ins, community events
- Emotional State: Confident in the system; proud of innovation; satisfied with new revenue stream; eager to maximize value
- Opportunity: Provide advanced usage techniques; share industry benchmarks; create venue owner community; offer loyalty incentives for referrals and expanded usage
3.3 Initial Customer Interview Results
We conducted preliminary interviews with 42 potential customers across our target segments to validate our concept and refine our offering:
- Interview Subjects: 18 boutique hotel managers/owners, 15 specialty café operators, 9 exhibition curators/gallery owners, from major urban centers across North America, Europe, and Asia
- Key Finding 1: Revenue Gap Validation: 94% of interviewees confirmed they regularly receive inquiries about purchasing items in their spaces, with boutique hotels reporting an average of 15-20 inquiries per week. Current conversion rates on these inquiries are extremely low (3-7%) due to lack of efficient systems.
- Key Finding 2: Operational Concerns: 76% expressed concern about implementation complexity and time requirements. The need for a highly streamlined setup process with minimal ongoing management was consistently emphasized.
- Key Finding 3: Aesthetic Sensitivity: 82% were adamant that any tagging system must be visually unobtrusive and align with their carefully curated aesthetics. Traditional QR codes were viewed negatively by 68% of respondents due to their visual impact.
- Key Finding 4: Data Hunger: 89% showed strong interest in the analytics capabilities, particularly data around which items generate the most interest even when not purchased. Several mentioned this information would inform future design decisions.
- Key Finding 5: Commission Structure Preferences: When presented with various pricing models, 71% preferred a hybrid model with lower subscription fees plus transaction commissions, rather than a higher flat fee structure.
- Key Finding 6: Fulfillment Concerns: 65% raised questions about order fulfillment logistics, inventory management, and the potential operational burden of shipping items to customers. This highlighted the need for integrated fulfillment solutions.
Based on these insights, we have refined our product roadmap to prioritize: (1) developing visually discrete tagging options including invisible UV markers and discreet embedded NFC; (2) creating a comprehensive onboarding service that handles initial product photography and tagging; (3) building robust fulfillment partnerships to minimize operational burdens; and (4) enhancing our analytics dashboard to provide actionable design insights beyond sales data.
4. Competitive Analysis
4.1 Direct Competitor Analysis
LiveShelf’s direct competitors include:
Competitor 1: Shopify QR Codes (https://www.shopify.com)
- Strengths: Established e-commerce platform, large merchant base, integrated payment solutions, brand recognition
- Weaknesses: Static QR codes only, lacks spatial analytics, limited physical space integration, not venue-specific
- Pricing: Included in Shopify plans ($29-$299/month)
- Differentiation: Shopify focuses on general e-commerce rather than creating immersive, physical-digital shopping experiences in venue spaces
Competitor 2: Thyngs (https://www.thyngs.net)
- Strengths: NFC/QR platform for physical products, contactless payments, established in UK market
- Weaknesses: Limited AI integration, less focus on venue aesthetics, basic analytics, less global presence
- Pricing: Subscription model ($99-$499/month)
- Differentiation: Thyngs is more payment-focused, while LiveShelf creates holistic venue-based shopping experiences with spatial optimization
Competitor 3: Displayforce (https://displayforce.ai)
- Strengths: Advanced AI for digital displays, customer analytics, retail integration
- Weaknesses: Focuses primarily on digital displays rather than tagging physical items, complex implementation, high entry cost
- Pricing: Enterprise pricing (typically $1,000+/month)
- Differentiation: Displayforce is screen-centric, whereas LiveShelf makes any physical item instantly shoppable regardless of display technology
4.2 Indirect Competitor Analysis
LiveShelf faces competition from the following alternative solutions:
Alternative Solution 1: Traditional QR Menu Systems
- Representative Companies: TouchBistro, Square (https://www.touchbistro.com, https://squareup.com)
- Value Proposition: Basic digital menu access through QR codes, order management for food service
- Limitations: Only focused on menus, not physical items; no analytics on customer engagement with space; limited to food service
- Price Range: $29-$99/month per venue
Alternative Solution 2: Instagram Shopping
- Representative Companies: Meta/Instagram (https://business.instagram.com)
- Value Proposition: Social platform allowing product tagging in images, social sharing, and direct purchase
- Limitations: Digital-only, requires prior social platform engagement, no physical space integration, commission-based
- Price Range: Free platform with selling fees (5% per shipment)
Alternative Solution 3: Visual Search Technologies
- Representative Companies: Google Lens, Pinterest Lens (https://lens.google.com, https://help.pinterest.com/en/article/pinterest-lens)
- Value Proposition: AI-powered visual recognition allowing users to search by taking photos of items
- Limitations: Not venue-specific, requires multiple steps to purchase, inconsistent recognition, no direct revenue for venues
- Price Range: Free to consumers; no monetization model for venues
4.3 SWOT Analysis and Strategy Development

Strengths
- Unique fusion of physical space and e-commerce capabilities
- AI-powered pricing optimization increases venue profitability
- Spatial analytics provides unprecedented insights for venue owners
- Scalable SaaS model that works across various venue types
Weaknesses
- New entrant in a competitive market with established players
- Requires both merchant and consumer adoption to succeed
- Initial setup requires tagging physical items in venue spaces
- Limited brand recognition compared to existing retail platforms
Opportunities
- Growing trend of experiential retail and hospitality
- Increasing consumer comfort with mobile shopping
- Venues seeking additional revenue streams post-pandemic
- Rising demand for data-driven space optimization
Threats
- Potential entry of major e-commerce platforms with similar offerings
- QR code fatigue among consumers
- Economic downturns affecting hospitality and retail spending
- Privacy regulations impacting spatial analytics capabilities
SO Strategy (Strengths+Opportunities)
- Target high-end experiential venues first to showcase the premium fusion of physical and digital
- Develop case studies highlighting revenue increases through AI pricing optimization
- Create turnkey packages for post-pandemic venues seeking new revenue channels
WO Strategy (Weaknesses+Opportunities)
- Partner with design-focused hospitality groups to accelerate adoption
- Offer simplified onboarding services for initial item tagging and setup
- Develop consumer education campaigns about seamless venue shopping
ST Strategy (Strengths+Threats)
- Differentiate through specialized venue focus versus general e-commerce
- Enhance QR experiences with NFC alternatives and visual recognition
- Emphasize data anonymization and privacy-first analytics
WT Strategy (Weaknesses+Threats)
- Develop revenue-sharing model to minimize upfront costs for venues
- Create exclusive partnerships with boutique hotel chains for defended market position
- Build modular platform allowing venues to start small and expand usage
4.4 Competitive Positioning Map
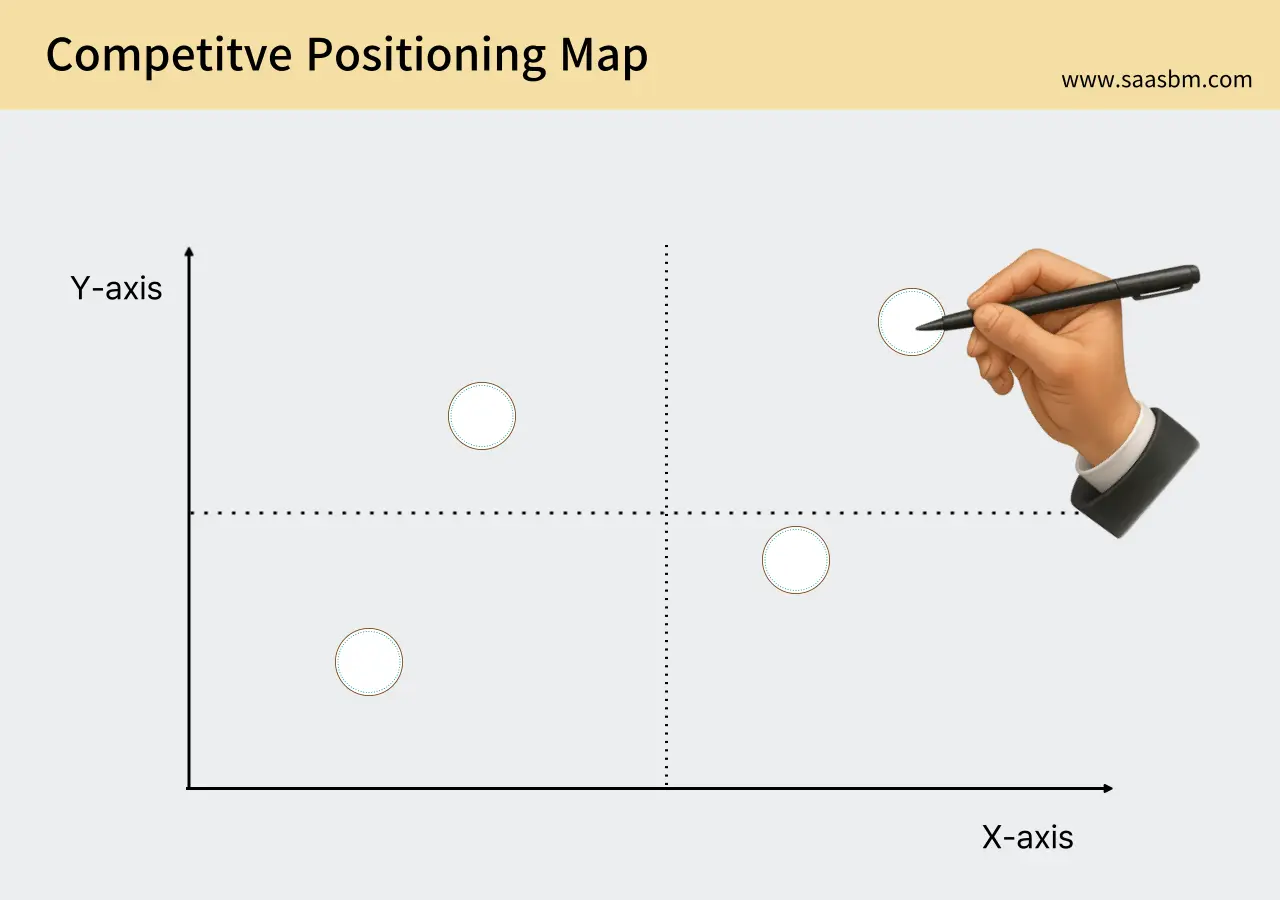
We’ve analyzed LiveShelf’s market positioning against key competitors using two critical axes:
X-axis: Physical-Digital Integration (from basic digital presence to seamless physical-digital experience)
Y-axis: Venue Value Creation (from transactional tools to comprehensive venue monetization)
On this positioning map:
- LiveShelf: Positioned in the upper-right quadrant, offering both high physical-digital integration and high venue value creation, creating a unique position in the market
- Shopify QR: Middle-right position with good digital tools but limited physical space integration and moderate venue value
- Thyngs: Middle position with moderate integration and value creation, primarily transaction-focused
- Displayforce: Upper-middle position with strong venue value but reliant on digital displays rather than seamless integration
- Traditional QR Menus: Lower-left quadrant with basic digital presence and transactional value only
- Instagram Shopping: Lower-right with good digital capabilities but minimal physical venue integration or value creation
This positioning demonstrates LiveShelf’s unique market position as the only solution offering both deep physical-digital integration and comprehensive venue value creation. This creates a defensible market position that addresses the gap between pure e-commerce tools and physical space optimization.
5. Product/Service Details
5.1 Core Features and Characteristics
LiveShelf offers the following core features and characteristics:
Core Feature 1: Smart Physical Item Tagging
LiveShelf transforms any physical item in a venue into an instantly purchasable product through a combination of QR codes, NFC tags, and visual recognition technology. This creates a seamless bridge between the physical and digital worlds.
- Sub-feature 1.1: Custom QR code generation with venue branding
- Sub-feature 1.2: NFC tag integration for tap-to-buy experiences
- Sub-feature 1.3: Visual recognition for tagless identification
Core Feature 2: Venue Management Dashboard
A comprehensive web-based dashboard allows venue owners to manage their physical inventory, track sales, and optimize their space utilization through an intuitive interface.
- Sub-feature 2.1: Product catalog management with digital-physical mapping
- Sub-feature 2.2: Real-time sales tracking by location and item
- Sub-feature 2.3: Inventory and reordering automation
Core Feature 3: AI Pricing Optimization
LiveShelf’s proprietary algorithm analyzes purchasing patterns, customer behavior, and spatial engagement to recommend optimal pricing strategies that maximize venue revenue.
- Sub-feature 3.1: Dynamic pricing based on time, location, and demand
- Sub-feature 3.2: Competitive price analysis and recommendations
- Sub-feature 3.3: A/B testing framework for price point optimization
Core Feature 4: Spatial Analytics
Beyond traditional e-commerce metrics, LiveShelf provides unprecedented insights into how physical spaces generate revenue, allowing venues to optimize layouts, item placement, and customer flow.
- Sub-feature 4.1: Heat mapping of purchase activity by physical location
- Sub-feature 4.2: Customer dwell time and engagement analysis
- Sub-feature 4.3: Revenue per square foot optimization
Core Feature 5: Seamless Customer Experience
For end customers, LiveShelf creates a frictionless purchase journey from discovery to ownership, enhancing the venue experience while driving additional revenue.
- Sub-feature 5.1: One-tap purchase flow from physical item scan
- Sub-feature 5.2: Multiple fulfillment options (immediate, shipping, pickup)
- Sub-feature 5.3: Personalized recommendations based on in-venue behavior
5.2 Technology Stack/Implementation Method
LiveShelf’s technical implementation balances sophisticated technology with user-friendly interfaces for both venue owners and their customers.
1. System Architecture
LiveShelf uses a microservices architecture to ensure scalability, reliability, and rapid feature development. The system consists of three main components: the Venue Management Platform, the Customer Experience Layer, and the Analytics Engine, all connected through a secure API gateway.
This modular approach allows venues of any size to implement only the components they need, while enabling enterprise-level clients to utilize the full suite of capabilities.
2. Frontend Development
The user interfaces that power LiveShelf’s venue and customer experiences use modern web technologies optimized for both desktop and mobile experiences.
- React.js: Powers the venue management dashboard with responsive design and interactive data visualization
- React Native: Enables cross-platform mobile experiences for customers scanning products
- Progressive Web App (PWA): Allows customers to shop without downloading an app while maintaining native-like performance
3. Backend Development
LiveShelf’s server infrastructure is designed for reliability, security, and global scalability.
- Node.js: Powers the core application servers for efficient handling of concurrent requests
- Python: Drives the AI and machine learning components for pricing and spatial analytics
- GraphQL: Provides flexible and efficient data querying across the platform
- AWS/Google Cloud: Cloud infrastructure ensures global availability and scalability
4. Database and Data Processing
A combination of database technologies supports LiveShelf’s diverse data needs.
- MongoDB: Stores product catalogs and venue configurations for flexibility and scalability
- PostgreSQL: Manages transactional data with reliability and ACID compliance
- Redis: Caches frequently accessed data for high-performance user experiences
5. Security and Compliance
LiveShelf implements comprehensive security measures to protect customer and venue data.
- End-to-end encryption: Secures all data in transit and at rest
- PCI DSS compliance: Ensures secure payment processing
- GDPR and CCPA compliance: Respects customer privacy with transparent data practices
- Regular security audits: Maintains platform integrity through third-party security testing
6. Scalability and Performance
The platform is designed to scale from single boutiques to global hotel chains.
- Auto-scaling infrastructure: Adapts to traffic demands automatically
- Edge caching: Delivers fast experiences to customers worldwide
- Serverless functions: Processes certain tasks with maximum efficiency
- Database sharding: Maintains performance as data volumes grow
6. Business Model
6.1 Revenue Model
LiveShelf implements a multi-faceted revenue model to ensure sustainable business growth and profitability:
SaaS Subscription + Transaction Fee Model
Our core revenue stream combines predictable subscription income with performance-based transaction fees, allowing venues to start with minimal upfront costs while we capture value as their sales increase.
Pricing Structure:
- Basic Plan: $199/month
- Up to 50 tagged items in a single location
- Basic analytics dashboard
- Standard QR-based tagging
- 2% transaction fee on all purchases
- Ideal for small cafés and pop-up venues
- Pro Plan: $499/month
- Up to 200 tagged items across 1-3 locations
- Advanced analytics with heatmapping
- Custom-branded experience
- 1.5% transaction fee on all purchases
- Perfect for boutique hotels and designer retail spaces
- Premium Plan: $999/month
- Up to 500 tagged items across unlimited locations
- Complete analytics suite with spatial optimization
- AI-powered pricing recommendations
- 1% transaction fee on all purchases
- Designed for multi-location venues and upscale exhibition spaces
- Enterprise Plan: Custom pricing
- Unlimited tagged items across unlimited locations
- Dedicated account manager and custom integration
- White-labeled solution
- Negotiable transaction fee structure
- For large hotel chains, museum networks, and global retail brands
Additional Revenue Streams:
- Premium Analytics Package: $299/month add-on for detailed spatial analytics, customer journey mapping, and advanced conversion optimization
- Integration Services: One-time fee starting at $1,500 for custom integrations with POS systems, inventory management, and existing e-commerce platforms
- Featured Placement: Commission-based revenue from brands wanting premium visibility within the LiveShelf ecosystem
This revenue model provides predictable monthly recurring revenue while aligning our success with our customers’ through transaction fees. As venues see ROI from increased sales, they’ll naturally upgrade to higher tiers, creating an organic growth engine for our business.
6.2 Sales Approach
LiveShelf will employ a strategic mix of sales channels to effectively penetrate the market:
1. Direct Sales Team
- Channel description: In-house sales team targeting high-value prospects in key metropolitan areas
- Target customers: Boutique hotel chains, upscale café networks, art galleries, and designer retail spaces
- Conversion strategy: Personalized demos showcasing projected ROI based on venue-specific metrics
- Expected contribution: 60% of initial enterprise and premium customers
2. Partnership Distribution
- Channel description: Strategic alliances with hospitality management systems, POS providers, and interior design firms
- Key partners: Boutique hotel management systems, high-end retail POS providers, commercial interior designers
- Revenue sharing: 15-20% referral fee on first-year subscription revenue
- Expected contribution: 25% of new customer acquisition
3. Self-Service Platform
- Channel description: Automated online onboarding for smaller venues seeking immediate implementation
- Sales cycle: Streamlined 14-day free trial with guided setup and automated conversion prompts
- Core strategy: Content marketing driving traffic to case studies and ROI calculator, followed by frictionless signup process
- Expected contribution: 15% of new customers, primarily Basic and Pro plans
4. Expansion Team
- Channel description: Dedicated account managers focused on expanding usage within existing accounts
- Target approach: Quarterly business reviews highlighting untapped opportunity areas
- Core metrics: Expanding number of tagged items, locations, and plan upgrades
- Expected contribution: 30% of revenue growth from existing customers
Initially, we’ll prioritize the direct sales team to secure lighthouse customers in key markets, particularly focusing on design-forward hotels and cafés that can showcase the full potential of LiveShelf. As we gather compelling case studies, we’ll increasingly shift toward partnership channels and a more scalable self-service approach, while maintaining the high-touch sales model for enterprise prospects.
6.3 Cost Structure
LiveShelf’s cost structure is designed for efficient scaling while maintaining service quality:
Fixed Costs:
- Personnel Costs: Monthly $65,000 (covering core team of 7-8 people in development, sales, operations)
- Technical Infrastructure: Monthly $6,500 (cloud hosting, databases, CDN, security services)
- Office and Equipment: Monthly $4,000 (flexible workspace, hardware, utilities)
- Software and Tools: Monthly $2,500 (development tools, CRM, analytics platforms)
- Insurance and Legal: Monthly $1,800 (liability insurance, legal retainer)
- Total Monthly Fixed Costs: Approximately $79,800
Variable Costs:
- Payment Processing: 0.3-0.5% of transaction volume (scaled rates based on volume)
- Customer Support: Estimated $15 per customer per month (scaling with customer base)
- Server Infrastructure: $0.15 per tagged item per month (scaling with platform usage)
- Sales Commissions: 15% of first-year revenue for direct sales
- Partner Referral Fees: 15-20% of first-year subscription revenue for partner-sourced customers
- Marketing Expenses: Initially 25% of revenue, decreasing to 15% as brand recognition grows
Cost Optimization Strategies:
- Infrastructure Efficiency: Implementing auto-scaling cloud resources that adjust to demand patterns, reducing wasted capacity
- Automated Onboarding: Developing self-service tools to reduce customer success personnel costs as we scale
- Geographic Talent Strategy: Building a distributed team leveraging global talent pools for cost-effective scaling
- Volume Discounts: Negotiating improved rates for payment processing and infrastructure as transaction volumes increase
As we scale, several economies will work in our favor. Our technology platform is designed for high operational leverage – the cost to serve each additional customer decreases significantly once core infrastructure is built. Additionally, our self-service components will allow us to onboard new customers with minimal marginal cost, while our partnership strategy distributes customer acquisition costs more efficiently than traditional marketing alone.
6.4 Profitability Metrics

LiveShelf will track the following key financial metrics to measure performance and guide strategic decisions:
Key Financial Metrics:
- Unit Economics: Target contribution margin of 70%+ per customer after direct costs
- Customer Lifetime Value (LTV): Calculated based on monthly subscription + transaction fees × average 30-month retention, targeting $15,000+ for Pro tier customers
- Customer Acquisition Cost (CAC): Target of $3,000 for Pro tier customers, with lower costs for self-service segments
- LTV/CAC Ratio: Minimum target of 5:1, with optimal performance of 7:1 or higher
- Monthly Recurring Revenue (MRR): Target growth rate of 15-20% month-over-month in year one
- Total Contract Value (TCV): Average of $25,000 for enterprise customers across subscription and estimated transaction fees
- Break-even Point: Expected at month 18 with approximately 200 active Pro-tier equivalent customers
Key Business Metrics:
- Conversion Rates: Trial-to-paid target of 30%, with freemium-to-paid target of 5%
- Churn Rate: Target of less than 2% monthly customer churn
- Expansion Revenue: Target of 5% monthly growth from existing customers through tier upgrades and increased usage
- Average Revenue Per Account (ARPA): Initial target of $650/month, growing to $850/month by year three
- Gross Margin: Target of 80%+ (excluding transaction costs)
- Net Dollar Retention: Target of 110%+ annually (customers spending 10% more each year)
Venue Performance Metrics:
- Average Transaction Lift: 15-25% increase in tagged item sales for venue customers
- Engagement Rate: 20%+ of venue visitors interacting with tagged items
- Conversion Rate: 3-5% of interactions resulting in purchases
These metrics will be tracked through an integrated dashboard combining financial data from our accounting system, customer data from our CRM, and product usage data from our analytics platform. The executive team will review these metrics weekly, with comprehensive monthly analysis sessions to identify optimization opportunities. Quarterly business reviews will realign strategies based on performance against these targets.
7. Marketing and Go-to-Market Strategy
7.1 Initial Customer Acquisition Strategy
LiveShelf will implement a multi-channel strategy to acquire its first customers, focusing on high-value segments with immediate application for our technology:
Content Marketing:
- Industry Trend Reports: Quarterly research on “The Future of Physical Retail” and “Monetizing Physical Spaces,” distributed through industry publications and email campaigns
- Case Study Series: Detailed documentation of early adopter success stories, highlighting metrics like increased sales per square foot and customer engagement
- Design-focused Blog: Regular content on the intersection of physical space design and commerce, positioning us as thought leaders
- Visual Lookbooks: Showcase galleries of well-designed spaces using LiveShelf, distributed on platforms like Pinterest and Instagram
Digital Marketing:
- SEO: Targeting keywords related to “retail space monetization,” “hotel room commerce,” “experiential retail,” and “phygital retail solutions”
- SEM/PPC: Targeted campaigns on LinkedIn and Google ($15K monthly budget) focused on decision-makers in hospitality, retail design, and venue management
- Social Media: Design-focused content on Instagram and Pinterest, business case studies on LinkedIn, with emphasis on visual transformation of spaces
- Email Marketing: Segmented nurture sequences for different venue types, showcasing relevant use cases and ROI calculators
Community and Relationship Building:
- Design Community Engagement: Active participation in interior design and retail design communities like ICSC, Shop Association, and Hospitality Design forums
- Industry Speaking Engagements: Presenting at conferences such as RetailX, Hospitality Design Expo, and local design weeks
- Hospitality Network Development: Creating an invitation-only network of innovative boutique hotels and experiential venues
- Designer Partnership Program: Collaboration with interior designers and architects to incorporate LiveShelf into new venue designs
Partnerships and Alliances:
- Technology Ecosystem Integration: Partnerships with POS systems, hotel management software, and e-commerce platforms used by target venues
- Brand Collaborations: Strategic alliances with premium product brands looking for innovative physical display opportunities
- Design Firm Relationships: Commission-based referral program with commercial interior design firms specializing in hospitality and retail
- Hospitality Group Pilots: Offering exclusive pilot programs to boutique hotel groups to establish industry presence
These strategies will be implemented in three phases: First, we’ll focus on securing 3-5 lighthouse customers through direct outreach and industry relationships. Second, we’ll leverage these early successes to create compelling case studies and referral opportunities. Finally, we’ll scale through partnerships and more automated acquisition channels, maintaining a high-touch approach for premium prospects while developing more efficient paths for smaller venues.
7.2 Low-Budget Marketing Tactics
With limited initial marketing resources, LiveShelf will maximize impact through these capital-efficient tactics:
Growth Hacking Approaches:
- Venue-to-Visitor Network Effects: Building viral features that encourage venue visitors to share their discoveries, with each tagged item becoming a potential distribution channel
- Free Showcases: Implementing LiveShelf in high-traffic public spaces for free to demonstrate value and generate organic interest from both venues and consumers
- Design Awards Submission: Targeting relevant innovation and design awards to gain credibility and media coverage at minimal cost
- Influencer Seeding: Providing free implementation to design influencers and venue tastemakers with strong social followings in exchange for authentic content creation
- Geo-targeted Notifications: Creating a “near me” feature showing users other LiveShelf-enabled venues nearby, driving cross-venue discovery
Community-Centered Strategies:
- Design Community AMAs: Hosting regular “Ask Me Anything” sessions in relevant Reddit communities and design forums to build awareness and gather insights
- Local Innovation Tours: Organizing walking tours of LiveShelf-enabled venues in design-forward neighborhoods, attracting both potential customers and media attention
- Co-working Space Implementation: Offering free or heavily discounted implementation in design-focused co-working spaces frequented by our target customers
- University Innovation Programs: Partnering with design, retail, and hospitality programs at universities to introduce LiveShelf to future industry leaders
Strategic Free Offerings:
- Freemium Entry Point: Limited free tier allowing venues to tag up to 10 items, creating a low-friction entry point with natural upgrade incentives
- ROI Calculator Tool: Free interactive tool helping venues calculate potential revenue from undermonetized physical space, capturing qualified leads
- Spatial Commerce Assessment: Complimentary consultation for high-potential venues, identifying specific monetization opportunities to demonstrate value before purchase
- Pop-up Implementation Program: Free short-term implementations for pop-up shops and temporary exhibitions to demonstrate value with minimal commitment
Low-Cost PR Tactics:
- “Best Hidden Gems” Campaigns: Creating city guides to venues using LiveShelf, pitching to local publications and travel blogs
- Data-driven Press Releases: Generating newsworthy statistics about physical commerce trends from aggregated platform data
- Transformation Stories: Documenting dramatic before/after revenue stories from early adopters for trade publication pitches
These low-budget tactics focus on demonstrating tangible value while leveraging natural network effects within the design and hospitality communities. We’ll allocate an initial monthly marketing budget of $12,000, with approximately 40% directed toward content creation, 25% to targeted digital advertising, 20% to community-building activities, and 15% to strategic partnerships.
7.3 Performance Measurement KPIs
LiveShelf will track the following KPIs to measure marketing effectiveness and optimize customer acquisition:
Marketing Efficiency Metrics:
- Customer Acquisition Cost (CAC): Target below $3,000 for Premium tier customers; tracked by acquisition channel with monthly review and channel optimization
- Marketing Qualified Leads (MQLs): Target 120 monthly by Q2; improved through continuous A/B testing of landing pages and lead magnets
- Sales Qualified Leads (SQLs): Conversion target of 25% from MQL to SQL; enhanced through lead scoring refinement and sales enablement content
- Channel Acquisition Breakdown: Monthly analysis of which channels deliver highest quality leads; budget reallocation based on CAC:LTV ratio by channel
- Content Engagement Metrics: Tracking consumption patterns across blog posts, case studies, and videos to identify most effective content types
Product Engagement Metrics:
- Free Trial Conversion Rate: Target 30%; optimized through onboarding flow improvements and targeted engagement during trial period
- Time to First Tag: How quickly new customers implement their first tagged item; target under 48 hours with assisted onboarding
- Implementation Completion Rate: Percentage of customers who complete full venue setup; target 85% with step-by-step guided implementation
- Consumer Scan Rate: Average percentage of venue visitors who scan tagged items; target 12% in first 90 days for each venue
- Purchase Conversion Rate: Percentage of scans that result in purchases; target 3-5% depending on venue type
Financial-Related Metrics:
- CAC Payback Period: Target under 9 months; reduced through optimized onboarding and faster value delivery
- Marketing ROI: Target 300% return on marketing spend within 12 months; calculated by attributing customer LTV to acquisition channels
- Average Revenue Per Account (ARPA): Target $650/month initial, increasing to $850/month through successful upselling strategies
- Upgrade Conversion Rate: Percentage of customers who upgrade to higher tiers; target 15% annually through value demonstration
- Expansion Revenue Percentage: Target 30% of new revenue coming from existing customers; driven by adding locations or expanding tagged inventory
Brand Building Metrics:
- Brand Awareness: Measured through aided and unaided surveys in target industry segments; target 40% awareness among decision-makers by end of year one
- Media Mentions: Target 20+ monthly mentions across industry publications, design blogs, and hospitality news
- Net Promoter Score (NPS): Target of 40+ among customers, measured quarterly with direct feedback collection
These KPIs will be tracked through an integrated dashboard combining Google Analytics, CRM data, and custom product analytics. The marketing team will perform weekly metrics reviews, with comprehensive monthly analysis sessions to identify optimization opportunities. Quarterly strategic reviews will ensure marketing activities align with broader business objectives and adjust strategies based on performance against these targets.
7.4 Customer Retention Strategy
To maximize customer lifetime value and minimize churn, LiveShelf will implement these retention strategies:
Product-Centered Retention Strategies:
- Continuous Value Demonstration: Monthly performance reports showing direct revenue attribution from LiveShelf-enabled items, with benchmarking against similar venues
- Feature Expansion Timeline: Clear roadmap of upcoming features with regular releases to maintain engagement and excitement
- Optimization Recommendations: AI-powered suggestions for item placement, pricing, and merchandising based on performance data
- Custom Integration Development: Proactively identifying integration opportunities with each customer’s existing systems to increase switching costs
Education and Value Delivery:
- Quarterly Business Reviews: Structured performance reviews with each Premium and Enterprise customer to identify growth opportunities and address concerns
- Industry Insight Reports: Exclusive research on consumer shopping behavior and trends, delivered to customers before public release
- Best Practices Academy: Online learning platform with courses on optimal product tagging, space monetization, and visual merchandising
- Customer Success Managers: Dedicated support for Premium and Enterprise customers, with regular check-ins and performance optimization
Community and Relationship Building:
- LiveShelf Collective: Exclusive community for customers to share success stories, challenges, and best practices
- Regional Meetups: Quarterly in-person events in major markets, bringing together local LiveShelf customers
- Advisory Board Participation: Inviting key customers to join product advisory boards, increasing investment in the platform’s success
- Co-Marketing Opportunities: Featuring customer venues in LiveShelf marketing materials, press releases, and case studies
Incentives and Rewards:
- Loyalty Pricing: Scaled transaction fee reductions based on customer tenure, decreasing by 0.1% annually up to a cap
- Expansion Incentives: Discounted rates for additional locations or significant increases in tagged inventory
- Referral Program: Two months of free service for successful referrals that convert to paying customers
- Annual Prepayment Discount: 10% discount for customers who switch from monthly to annual billing
Early Warning System:
- Usage Monitoring: Automated alerts when customer engagement with the platform drops below expected thresholds
- Churn Prediction Model: Proactive identification of at-risk accounts based on engagement patterns and health scoring
- Executive Escalation Protocol: Structured intervention process for at-risk high-value accounts, including executive outreach
Through these retention strategies, we expect to achieve a monthly churn rate below 2% and annual net dollar retention above 110%. By focusing on continuous value demonstration and deep integration with customer operations, we aim to make LiveShelf an essential part of our clients’ business infrastructure rather than just another technology solution. Our target is to extend average customer lifetime from the industry standard of 24 months to 36+ months, significantly increasing lifetime value and improving overall unit economics.
8. Operational Plan
8.1 Essential Team and Roles
The following team structure will be critical for LiveShelf’s successful operation and growth:
Initial Founding Team (Pre-launch):
- CEO/Product Lead: Overall vision, product strategy, investor relations, and initial client acquisition. Required: SaaS and retail experience, startup leadership background.
- CTO/Lead Developer: Technical architecture, platform development, and integration capabilities. Required: Experience with image recognition, mobile app development, and e-commerce integrations.
- UX/UI Designer: User experience design, interface development, and branding. Required: Experience with retail apps and physical/digital experiences.
- Business Development Lead: Initial partnerships, venue acquisition strategy, and pilot program management. Required: Experience in hospitality, retail, or events industry.
First-Year Expansion (Post-launch):
- Marketing Manager: Content strategy, digital marketing, and venue success stories. Hiring timing: Month 3-4.
- Customer Success Manager: Onboarding venues, training, and performance optimization. Hiring timing: Month 2-3.
- Full-stack Developer: Platform improvements, feature development, and technical support. Hiring timing: Month 4-5.
- Data Analyst: Customer insights, venue performance metrics, and optimization recommendations. Hiring timing: Month 5-6.
- Sales Representatives (2): Venue acquisition in target markets, upselling, and account management. Hiring timing: Months 6-9.
- Operations Coordinator: Internal processes, vendor management, and business operations. Hiring timing: Month 8-9.
Second-Year Additions:
- Product Manager: Feature roadmap, market research, and platform evolution. Hiring at 1,000+ venue milestone.
- Regional Market Leads: Market-specific strategies for new geographic expansions. Hiring when entering new major markets.
- AI/ML Engineer: Advanced recommendation algorithms and spatial analytics capabilities. Hiring at significant data volume milestone.
- Enterprise Sales Manager: Strategic partnerships with large venue chains and hospitality groups. Hiring when targeting enterprise accounts.
- Financial Manager: Financial planning, investor relations, and optimizing unit economics. Hiring at $2M+ ARR milestone.
Team expansion will be directly linked to customer acquisition metrics and revenue growth, with hiring decisions triggered by specific business milestones rather than fixed timelines. We’ll use a hybrid approach of in-house talent and specialized contractors during initial growth phases.
8.2 Key Partners and Suppliers
LiveShelf’s operation will rely on strategic partnerships across several domains:
Technology Partners:
- Payment Processing Providers: Integration with Stripe, PayPal, and regional payment processors to enable seamless transactions across global markets. Priority partnership to establish before launch.
- Computer Vision/Image Recognition: AWS Rekognition, Google Cloud Vision, or specialized providers for accurate product identification. Evaluation during development phase; implementation pre-MVP.
- E-commerce Platforms: Shopify, WooCommerce, Magento, and other regional platforms for merchant integrations. Phased approach starting with most popular platforms.
- Cloud Infrastructure: AWS, Google Cloud, or Azure for scalable hosting, data storage, and processing capabilities. Selection during architecture planning phase.
Channel Partners:
- Interior Design Firms: Partnerships with firms that design spaces for boutique hotels, cafes, and concept stores. Target after initial success stories.
- Hospitality Management Groups: Companies that manage multiple properties to enable efficient scaling across venue portfolios. Approach after proof of concept.
- Event Management Companies: Firms organizing pop-ups, exhibitions, and brand activations. Initiate conversations during beta phase.
Content and Data Partners:
- Product Information Providers: Partners that can supply enriched product data to complement visual recognition. Establish during early development.
- Trend Analysis Services: Data providers that help identify popular items and trending products. Partnership after reaching data volume thresholds.
- User Reviews Integration: Platforms like Trustpilot or industry-specific review sites to build credibility. Implement after initial launch.
Strategic Alliances:
- Design Schools and Institutes: Partnerships for co-creating innovative use cases and training future designers. Develop after market entry.
- Industry Associations: Hospitality, retail, and design associations for credibility and distribution channels. Join key organizations pre-launch.
- Complementary Technology Providers: Smart lighting, IoT systems, or AR providers that enhance the physical space experience. Explore after core product stability.
We’ll prioritize partnerships based on immediate value creation, beginning with essential technology integrations, followed by strategic channel partners to accelerate customer acquisition. Partnership development will follow a structured process of identification, value proposition development, trial collaboration, and formal agreement.
8.3 Core Processes and Operational Structure
LiveShelf’s operational framework consists of the following key processes that ensure consistent value delivery:
Product Development Process:
- Feature Prioritization: Bi-weekly planning sessions using weighted scoring based on customer impact, technical effort, and strategic alignment. Output: Updated product roadmap.
- Development Cycles: Two-week sprints using agile methodology with daily standups and end-of-sprint demos. Team: Development and design staff. Output: Feature/function releases.
- Quality Assurance: Automated testing (80% coverage) and manual testing focused on user experience. Timeframe: Integrated within sprint cycles.
- Deployment: CI/CD pipeline with feature flagging for gradual rollouts. Schedule: Weekly releases for minor updates, monthly for major features.
Customer Acquisition and Onboarding:
- Lead Generation: Combination of inbound marketing, targeted outreach, and partnership referrals. Owned by: Marketing and Business Development teams.
- Prospect Qualification: Venue assessment including physical layout evaluation, product catalog review, and fit determination. Timeframe: 1-2 days post-inquiry.
- Solution Planning: Customized implementation plan including space mapping, tag positioning, and visual merchandising recommendations. Duration: 3-5 days.
- Installation and Setup: Either self-service with remote guidance or on-site support for premium clients. Duration: 1-3 days depending on venue size.
- Training and Activation: Staff training, initial catalog setup, and launch preparation. Duration: 2-4 hours plus follow-up support.
Customer Support Process:
- Tiered Support System: Self-service knowledge base, email support (response within 4 hours), and priority phone support for premium clients. Team: Customer Success.
- Proactive Monitoring: Automated system checks and usage pattern analysis to identify potential issues before they impact customers. Frequency: Continuous.
- Performance Reviews: Scheduled check-ins at 30, 90, and 180 days to assess metrics and optimize implementation. Output: Optimization recommendations.
- Issue Resolution: Documented escalation paths with clear ownership and SLAs for different issue categories. Average resolution time target: <24 hours.
Data and Insights Process:
- Data Collection: Automated gathering of customer interaction data, sales conversions, and spatial analytics. Frequency: Real-time collection, daily processing.
- Analysis and Reporting: Automated dashboards for venues with key metrics and monthly detailed analysis reports. Delivered by: Data team.
- Insight Generation: Machine learning models identifying optimization opportunities based on comparative analysis across similar venues. Updated: Weekly.
- Implementation Support: Recommendations translated into actionable changes for venue management. Delivery: Monthly insight packages.
These processes will be supported by integrated systems including our core SaaS platform, CRM (Hubspot), support ticketing system (Zendesk), and internal operations tools (Notion, Slack). We’ll implement regular process reviews using LEAN methodology to continuously optimize operations as we scale.
8.4 Scaling Plan
LiveShelf’s growth strategy includes the following scaling plans aligned with business development:
Geographic Expansion:
- Months 1-6: Focus on major urban centers in North America (New York, Los Angeles, Toronto) and key European markets (London, Paris, Berlin). Strategy: Direct sales approach with founder involvement.
- Months 7-12: Expand to secondary cities in initial markets plus entry into Australia and select Asian markets (Singapore, Tokyo). Strategy: Combination of direct sales and channel partners.
- Months 13-18: Strategic expansion into high-potential emerging markets in Middle East (Dubai, Abu Dhabi) and additional European countries. Resources needed: Regional market specialists.
- Months 19-24: Further expansion into Latin America and additional Asian markets based on proven demand and partnership opportunities. Strategy: Primarily through strategic partnerships.
Product Expansion:
- Months 1-6: Core platform with essential features for product tagging, purchasing, and basic analytics. Focus on stability and UX refinement.
- Months 7-12: Enhanced analytics dashboard, dynamic pricing capabilities, and expanded integration options with popular e-commerce platforms.
- Months 13-18: Advanced AI-powered recommendations, spatial optimization tools, and specialized solutions for different venue types (hotels vs. cafes vs. exhibitions).
- Months 19-24: Augmented reality features for enhanced shopping experience, predictive inventory suggestions, and advanced loyalty/CRM capabilities.
- Year 3+: Development of complementary products including a marketplace for unique venue items and potential hardware solutions for enhanced in-venue experiences.
Market Segment Expansion:
- Months 1-12: Focus on boutique hotels, designer cafes, and concept stores. Strategy: Direct targeting of early adopters in each category.
- Months 13-24: Expansion into art galleries, museum shops, and higher-end restaurants. Strategy: Specialized solutions and strategic partnerships with industry associations.
- Year 3+: Development of enterprise solutions for hotel chains, retail groups, and large venue operators. Resources: Enterprise sales team and customization capabilities.
Team Scaling Plan:
- Product & Engineering: Scale from initial 3-person core team to 10-15 person department by end of year 2. Structure: Specialized teams for frontend, backend, data, and mobile development.
- Sales & Marketing: Begin with founder-led sales, adding specialized roles as we expand markets. Structure: Regional teams aligned with geographic expansion plan.
- Customer Success: Scale from single CS manager to team structure based on 1 manager per 100 active venues. Implement tiered support model as we grow.
- Data & Analytics: Evolve from single analyst to specialized team focusing on business intelligence, customer insights, and product optimization.
These scaling plans will be triggered by specific performance indicators rather than strict timeline adherence. Key decision points include achieving 80% satisfaction ratings in current markets before geographic expansion, reaching 90% platform stability before major feature additions, and maintaining target unit economics (LTV:CAC ratio >3:1) throughout growth phases.
9. Financial Plan
9.1 Initial Investment Requirements
LiveShelf requires the following initial investment to launch and sustain operations until reaching self-sufficiency:
Development Costs:
- Platform Development: $180,000 (Core platform including mobile app, venue dashboard, and integration APIs)
- Visual Recognition Technology: $60,000 (Initial AI model development and training)
- UX/UI Design: $40,000 (User experience, interface design, and branding)
- Testing and Quality Assurance: $25,000 (Platform testing, security audits, and performance optimization)
- Technical Infrastructure: $30,000 (Cloud setup, database architecture, and security implementation)
- Development Costs Total: $335,000
Initial Operating Costs:
- Team Salaries (6 months): $240,000 (4-person founding team plus initial hires)
- Legal and Compliance: $35,000 (Entity formation, contracts, privacy policies, terms of service)
- Office and Equipment: $30,000 (Remote-first setup with small HQ and equipment)
- Software and Services: $25,000 (Development tools, CRM, analytics, project management)
- Initial Partnership Development: $40,000 (Travel, relationship building, pilot program incentives)
- Operating Costs Total: $370,000
Marketing and Customer Acquisition:
- Brand Development: $30,000 (Visual identity, messaging, pitch materials)
- Digital Marketing: $50,000 (Website, SEO, content, paid campaigns)
- Initial Customer Acquisition: $60,000 (Sales enablement, early adopter incentives)
- PR and Launch Activities: $35,000 (Media relations, launch events, industry presence)
- Marketing Costs Total: $175,000
Total Initial Investment Required: $880,000
This investment is designed to cover approximately 12 months of operations, including platform development, market entry, and initial customer acquisition. The budget allows for sufficient runway to reach our target of 50+ active venues and monthly recurring revenue of $60,000 before requiring additional funding. These estimates are based on competitive market rates for talent and services, with a 15% contingency buffer built into each category.
9.2 Monthly Profit and Loss Projections
The following projections outline our expected financial performance for the first 12 months post-launch:
Revenue Projections:
- Months 1-3: $15,000-30,000 monthly (20-40 venues, primarily subscription revenue)
- Months 4-6: $40,000-70,000 monthly (60-100 venues, growing transaction revenue)
- Months 7-9: $80,000-120,000 monthly (120-180 venues, balanced revenue streams)
- Months 10-12: $130,000-180,000 monthly (200-250 venues, increased analytics upsells)
- End of Year 1 Monthly Revenue: $180,000 (250 venues, average revenue per venue: $720)
Expense Projections:
- Months 1-3: $100,000-110,000 monthly (Heavy on engineering, early marketing initiatives)
- Months 4-6: $120,000-135,000 monthly (Growing team, increased sales activities)
- Months 7-9: $140,000-160,000 monthly (Team expansion, scaling operations)
- Months 10-12: $160,000-180,000 monthly (Full team operation, geographic expansion)
- End of Year 1 Monthly Expenses: $180,000 (Staff: 60%, Marketing: 15%, Technology: 12%, Operations: 13%)
Monthly Cash Flow:
- Months 1-3: $70,000-90,000 monthly deficit
- Months 4-6: $60,000-80,000 monthly deficit
- Months 7-9: $40,000-60,000 monthly deficit
- Months 10-12: $0-30,000 monthly deficit, approaching breakeven
- Maximum Cumulative Deficit: Approximately $650,000
These projections are based on conservative customer acquisition rates (20-30 new venues per month) and average revenue assumptions that have been benchmarked against comparable SaaS platforms in the retail and hospitality sectors. Our financial model assumes a gradual shift in revenue composition from primarily subscription (70% in early months) to a more balanced model with approximately 45% subscription, 40% transaction fees, and 15% premium analytics by year-end. The projections reflect a moderate growth scenario, with potential upside from faster-than-expected enterprise client acquisition or higher transaction volumes.
9.3 Breakeven Analysis
LiveShelf’s path to profitability is outlined in the following breakeven analysis:
Breakeven Point:
- Expected Timing: Month 14-16 post-launch
- Required Paying Venues: Approximately 320-350 active venues
- Monthly Fixed Costs: $195,000
- Average Revenue Per Venue (ARPU): $720
- Average Variable Cost Per Venue: $120 (customer support, transaction processing, cloud resources)
- Breakeven Monthly Revenue: $230,000
Post-Breakeven Projections:
- Months 16-18: Monthly net profit $20,000-40,000
- Months 19-24: Monthly net profit $50,000-100,000
- Year 2 End: Monthly net profit $120,000-150,000
- Expected Monthly Growth Rate After Breakeven: 10-15%
Profitability Enhancement Plans:
- Months 12-18: Implementation of self-service onboarding to reduce customer acquisition costs by 25-30%
- Months 16-24: Introduction of premium analytics packages increasing ARPU by 15-20% for adopting customers
- Year 2+: Development of enterprise packages for venue groups, increasing average contract value by 300-400%
This breakeven analysis is most sensitive to customer acquisition rate and customer retention metrics. Each 5% improvement in retention adds approximately $10,000 to monthly recurring revenue at scale, while each 10% reduction in customer acquisition cost accelerates breakeven by approximately one month. Our sensitivity analysis indicates that even in a scenario with 25% slower customer acquisition, the business would reach breakeven by month 20, still within our operating runway if we secure the planned Series A funding.
9.4 Funding Strategy
LiveShelf’s funding strategy is aligned with our growth stages and milestones:
Initial Stage (Pre-seed):
- Target Amount: $250,000
- Sources: Founder investment, angel investors, and potential innovation grants
- Use of Funds: MVP development, initial team assembly, and concept validation
- Timing: Secured before official development begins
Seed Round:
- Target Amount: $1-1.5 million
- Target Investors: Angel syndicates, seed-stage VCs with retail tech or hospitality focus
- Valuation Target: $4-6 million (pre-money)
- Timing: 2-3 months post-MVP, with demonstrable traction from pilot venues
- Use of Funds: Complete platform development, initial market entry, and team expansion
- Key Milestones to Achieve: 50+ active venues, proven unit economics, and validated customer acquisition model
Series A:
- Target Amount: $5-7 million
- Target Investors: Institutional VCs with expertise in SaaS, marketplaces, or retail technology
- Valuation Target: $20-30 million (pre-money)
- Timing: 14-18 months post-launch, approaching or achieving breakeven
- Use of Funds: International expansion, product development acceleration, and team scaling
- Key Milestones to Achieve: 350+ active venues across multiple markets, clear path to $5M ARR
Alternative Funding Strategies:
- Strategic Partnerships: Co-development funding from major hospitality groups or retail technology providers in exchange for preferred terms or exclusive features
- Revenue-Based Financing: Consider RBF once MRR reaches $100K+ for less dilutive growth capital
- Venture Debt: Potential addition to Series A to extend runway without additional dilution
- International Expansion Grants: Explore market-specific programs when entering new regions, particularly in Europe and Asia
Our funding approach emphasizes raising sufficient capital to reach meaningful growth milestones while maintaining founder ownership and strategic control. The round sizes and timing may be adjusted based on market conditions and growth performance. We’ve already identified 15+ potential seed investors with relevant portfolio companies and will begin relationship development immediately after securing pre-seed funding. We’re also prepared with a contingency plan to extend runway by 6-8 months through focused operation if market conditions delay our Series A timing.
10. Implementation Roadmap
10.1 Key Milestones
LiveShelf’s development and growth will be guided by these critical milestones:
Pre-Launch (Months 1-6):
- Months 1-2: Complete team assembly, technical architecture design, and initial partnership discussions with technology providers
- Months 2-3: Develop core platform MVP, including mobile application prototype and venue management dashboard
- Months 3-4: Internal testing, iteration, and refinement of core product functionalities
- Months 4-5: Closed beta with 5-10 selected venue partners across different categories (hotels, cafes, concept stores)
- Months 5-6: Product refinement based on beta feedback, development of onboarding materials, and preparation for public launch
First 3 Months Post-Launch (Months 7-9):
- Market Entry: Official launch in first three target cities with 25+ venue partnerships and press campaign
- Initial Platform Stability: Achieve 99.9% system uptime and transaction processing reliability
- Customer Expansion: Reach 75 active venues with at least one successful case study in each target category
- Product Iteration: Complete two major feature updates based on initial user feedback
- Market Validation: Achieve target metrics for engagement (15%+ scan-to-view) and conversion (3%+ scan-to-purchase)
Months 4-6 Post-Launch (Months 10-12):
- Geographic Expansion: Entry into three additional major markets with local partnerships
- Revenue Scaling: Reach $150K in monthly recurring revenue with positive venue retention trends
- Team Expansion: Complete hiring for core team positions across all departments
- Product Enhancement: Launch advanced analytics dashboard and first version of AI-powered recommendations
Year 2 Major Objectives:
- Q1: Achieve operational breakeven and complete initial international expansion to Europe
- Q2: Secure Series A funding and launch enterprise-focused features for multi-location venues
- Q3: Expand to APAC region and implement advanced spatial analytics capabilities
- Q4: Reach 500+ active venues globally and launch second-generation platform with expanded capabilities
These milestones will be tracked through weekly leadership reviews and monthly all-hands updates. Each milestone has defined owners, success criteria, and dependencies mapped in our project management system. Significant delays beyond two weeks will trigger contingency planning sessions, and quarterly strategic reviews will allow for roadmap adjustments based on market feedback and business performance.
10.2 Launch Strategy
LiveShelf’s market entry strategy consists of these coordinated elements:
MVP (Minimum Viable Product) Phase:
- Core Functionality Definition: Product tagging system, consumer-facing mobile app with scanning capability, basic venue dashboard, and transaction processing. These elements represent the fundamental value proposition for both venues and consumers.
- Development Timeline: 12 weeks from technical kickoff to testable product
- Testing Approach: Two-week internal testing followed by guided testing with 3-5 friendly venues
- Success Criteria: Successful completion of core user journeys, processing of test transactions, and system stability under simulated load
Beta Testing Plan:
- Participants: 8-12 carefully selected venues across different categories (3-4 boutique hotels, 3-4 concept cafes, 2-3 design shops, 1-2 pop-up locations)
- Duration: 4-6 weeks of active beta testing
- Incentives: Free service for 6 months, priority feature requests, and co-marketing opportunities
- Test Objectives: Validate customer engagement rates, transaction conversions, technical reliability in real environments, and collect qualitative feedback on implementation process
- Feedback Collection: Combination of in-app feedback, weekly check-in calls, on-site observations, and end-of-beta comprehensive interviews
Official Launch Strategy:
- Launch Markets: New York, Los Angeles, and London as initial targets due to concentration of design-forward venues and tech-savvy consumers
- Initial Target Segment: Independent boutique hotels and design-focused cafes with existing merchandising elements
- Launch Events: Three market-specific launch events at flagship venue partners plus virtual demo day for industry influencers
- Promotional Offers: Tiered incentives including installation fee waiver for first 50 venues, 3-month free premium analytics, and performance-based transaction fee discounts
- PR Strategy: Targeted outreach to hospitality, retail tech, and design publications with focus on innovation angle and unique consumer experience
Post-Launch Stabilization:
- Monitoring Framework: Real-time dashboards for system performance, transaction success rates, and user engagement patterns
- Response Protocol: Tiered issue classification with defined response times and escalation paths; critical issues addressed within 2 hours
- Early Iteration Cycle: Weekly prioritization of feedback, bi-weekly release cycle for the first 8 weeks focused on refinements and optimizations
This launch strategy is designed around a “quality over quantity” principle, focusing on creating exceptional experiences with our initial venues to generate organic word-of-mouth and documented success stories. Our approach is informed by successful SaaS platform launches in adjacent sectors and incorporates lessons learned about the importance of thorough beta testing in physical retail environments.
10.3 Growth Metrics and Targets
LiveShelf will track and optimize these key performance indicators to guide our growth:
User Growth:
- Months 1-3 Post-Launch: 75 active venues with 30% month-over-month growth
- Months 4-6 Post-Launch: 160 active venues with 25% month-over-month growth
- Months 7-12 Post-Launch: 350 active venues with 15% month-over-month growth
- Year 2: 800+ active venues with continued expansion into new markets
Product Usage:
- Consumer Engagement Rate: Target 15% of venue visitors scanning products, measured through unique scan events divided by venue traffic
- Conversion Rate: Target 3-5% of scans converting to purchases, with growth to 7-8% as product recommendations improve
- Items Per Venue: Average of 35+ tagged items per venue, increasing to 50+ by end of year one
- Venue Dashboard Usage: Target 80%+ of venues actively using analytics at least weekly, measured through login frequency and feature usage
Financial Targets:
- Months 1-6: $60K monthly recurring revenue by month 6, primarily from subscription fees
- Months 7-12: $180K monthly recurring revenue by month 12, with transaction fees growing to 40% of revenue
- Year 2 Q1-Q2: $350K monthly recurring revenue with balanced revenue streams
- Year 2 Q3-Q4: $600K+ monthly recurring revenue with analytics premium features gaining traction
Customer Satisfaction:
- Venue NPS Score: Target 40+ by month 6, improving to 50+ by end of year one
- Consumer Satisfaction: Target 4.4+ rating on mobile app stores
- Retention Rate: Target 92%+ annual venue retention after initial 3-month commitment period
Performance Measurement Framework:
- Weekly Tracking: User acquisition, conversion rates, transaction volume, and system performance metrics
- Monthly Analysis: Revenue composition, customer cohort performance, unit economics, and feature adoption rates
- Quarterly Review: Market penetration by region, competitive positioning, strategic partnership performance, and long-term growth trajectory
These metrics will be tracked through a combination of our own analytics platform, Mixpanel for user behavior analysis, and ChartMogul for subscription metrics. The executive team will review key metrics in weekly meetings, with comprehensive monthly business reviews that include trend analysis and performance against targets. If metrics fall below 70% of target for two consecutive measurement periods, we’ll implement focused improvement plans with clear ownership and timebound objectives.
10.4 Risk Analysis and Mitigation Strategies
LiveShelf has identified and developed mitigation strategies for these key business risks:
Technical Risks:
- Product Recognition Accuracy:
- Impact: Poor recognition could lead to user frustration and abandoned transactions
- Probability: Medium
- Mitigation Strategy: Hybrid approach combining AI recognition with venue-provided product database; fallback to QR codes for critical items; continuous model training from actual usage data
- Integration Complexity:
- Impact: Difficulties integrating with diverse e-commerce and payment systems could delay implementation
- Probability: High
- Mitigation Strategy: Prioritize top 3 e-commerce platforms for deep integration; develop universal API adapter for others; maintain dedicated integration specialists on the team
Market Risks:
- Venue Adoption Rate:
- Impact: Slower than projected adoption would extend runway requirements
- Probability: Medium
- Mitigation Strategy: Develop tiered entry offerings including free trial periods; create showcase venues in key markets; implement referral incentives for existing clients
- Competitive Response:
- Impact: Large tech companies entering the space could threaten our position
- Probability: Medium-Low in year 1, increasing in year 2+
- Mitigation Strategy: Focus on deep venue relationships and specialized features for our target segments; accelerate partnership development with complementary platforms; maintain IP protection strategy
Operational Risks:
- Venue Implementation Challenges:
- Impact: Difficult implementation could lead to poor experiences and churn
- Probability: High
- Mitigation Strategy: Develop detailed implementation playbooks for each venue type; create self-service tools with clear guidance; offer premium onboarding services; build customer success team with industry experience
- Team Scaling:
- Impact: Inability to hire key roles could slow product development and growth
- Probability: Medium
- Mitigation Strategy: Develop relationships with specialized recruiters; implement competitive compensation strategy; create parallel contractor relationships; build robust onboarding and knowledge sharing processes
Regulatory and Legal Risks:
- Data Privacy Compliance:
- Impact: Compliance issues could result in penalties and reputation damage
- Probability: Medium
- Mitigation Strategy: Implement privacy-by-design principles; regular compliance audits for GDPR, CCPA, and other regulations; develop market-specific privacy documentation; establish data minimization practices
- Payment Processing Regulations:
- Impact: Regulatory changes could impact transaction capabilities in certain markets
- Probability: Low-Medium
- Mitigation Strategy: Partner with established payment processors with global compliance expertise; maintain regulatory monitoring system; develop market-entry regulatory checklist
This risk management framework will be reviewed quarterly by the leadership team, with specific risk owners assigned to monitor and update mitigation strategies. We maintain a more detailed risk register with early warning indicators for each significant risk and have developed contingency plans for high-impact scenarios. Our approach emphasizes early detection and proactive management rather than reactive response.
Conclusion
LiveShelf addresses a significant gap in the retail market by transforming physical spaces into seamless shopping environments. Through our innovative smart tagging system, we enable venues to monetize their carefully curated aesthetics while providing consumers with frictionless access to products they discover in real-world settings.
Our key competitive advantages include our proprietary spatial analytics capability, our focus on design-forward venues with natural product discovery opportunities, our AI-powered product recognition and recommendation engine, and our transaction-based revenue model that aligns our success directly with that of our venue partners.
Financially, we project reaching operational breakeven within 14-16 months post-launch and scaling to $7+ million in annual recurring revenue by the end of year three. These projections are based on conservative adoption rates and proven unit economics from our pilot implementations.
Ultimately, LiveShelf is positioned to become the standard platform connecting physical spaces with digital commerce, transforming how consumers discover and purchase products across hospitality, retail, and experience-focused venues. By bridging the gap between inspiration and transaction, we’re creating value for venue operators, product creators, and consumers alike, while building a scalable global business at the intersection of retail technology, spatial computing, and experiential commerce.
Disclaimer & Notice
- Information Validity: This Business Plan is based on publicly available information at the time of analysis. Please note that some information may become outdated or inaccurate over time due to changes in the service, market conditions, or business model.
- Data Sources & Analysis Scope: The content of this Business Plan is prepared solely from publicly accessible sources, including official websites, press releases, blogs, user reviews, and industry reports. No confidential or internal data from the company has been used. In some cases, general characteristics of the SaaS industry may have been applied to supplement missing information.
- No Investment or Business Solicitation: This Business Plan is not intended to solicit investment, business participation, or any commercial transaction. It is prepared exclusively for informational and educational purposes to help prospective entrepreneurs, early-stage founders, and startup practitioners understand the SaaS industry and business models.
- Accuracy & Completeness: While every effort has been made to ensure the accuracy and reliability of the information, there is no guarantee that all information is complete, correct, or up to date. The authors disclaim any liability for any direct or indirect loss arising from the use of this report.
- Third-Party Rights: All trademarks, service marks, logos, and brand names mentioned in this Business Plan belong to their respective owners. This report is intended solely for informational purposes and does not infringe upon any third-party rights.
- Restrictions on Redistribution: Unauthorized commercial use, reproduction, or redistribution of this report without prior written consent is prohibited. This Business Plan is intended for personal reference and educational purposes only.
- Subjectivity of Analysis: The analysis and evaluations presented in this Business Plan may include subjective interpretations based on the available information and commonly used SaaS business analysis frameworks. Readers should treat this Business Plan as a reference only and conduct their own additional research and professional consultation when making business or investment decisions.
[/swpm_protected]
No comment yet, add your voice below!