
- Company : Databox, Inc.
- Brand : Databox
- Homepage : https://databox.com/
1. Service Overview
1.1 Service Definition
Databox is an all-in-one business analytics platform that enables companies to consolidate their performance metrics from multiple sources into unified, customizable dashboards for better decision-making and performance monitoring.
- Service Classification: Business Intelligence (BI) & Analytics SaaS Platform
- Core Features: Databox connects to 70+ data sources to aggregate metrics into real-time dashboards with automated reporting capabilities, goal tracking, and performance alerts.
- Established: 2012
- Service Description: Databox serves as a centralized analytics platform that pulls data from various marketing, sales, financial, and operational tools. It transforms fragmented data into cohesive, visual dashboards that can be customized for different stakeholders. The platform offers pre-built report templates, automated reporting schedules, and performance tracking with threshold-based alerts. Databox also provides collaborative features for teams to annotate insights and share findings across departments.
[swpm_protected for=”4″ custom_msg=’This report is available to Harvest members. Log in to read.‘]
1.2 Value Proposition Analysis
Databox delivers significant value by addressing the critical challenge of fragmented data visibility, providing a unified analytics solution that helps businesses make more informed decisions faster.
- Core Value Proposition: Databox solves the problem of dispersed business metrics across multiple platforms by providing a single source of truth for performance data, enabling more efficient performance monitoring and better, data-driven decision making.
- Primary Target Customers: Small to medium-sized businesses, particularly those with marketing, sales, and digital teams that use multiple software tools and need consolidated performance tracking. Databox also targets agencies that manage multiple client accounts and need to create client-facing reports efficiently.
- Differentiation Points: Databox stands out through its extensive integration library (70+ connectors), ease of use in dashboard creation without technical skills, pre-built report templates for quick setup, and automated reporting capabilities that save significant time compared to manual reporting processes.
1.3 Value Proposition Canvas Analysis
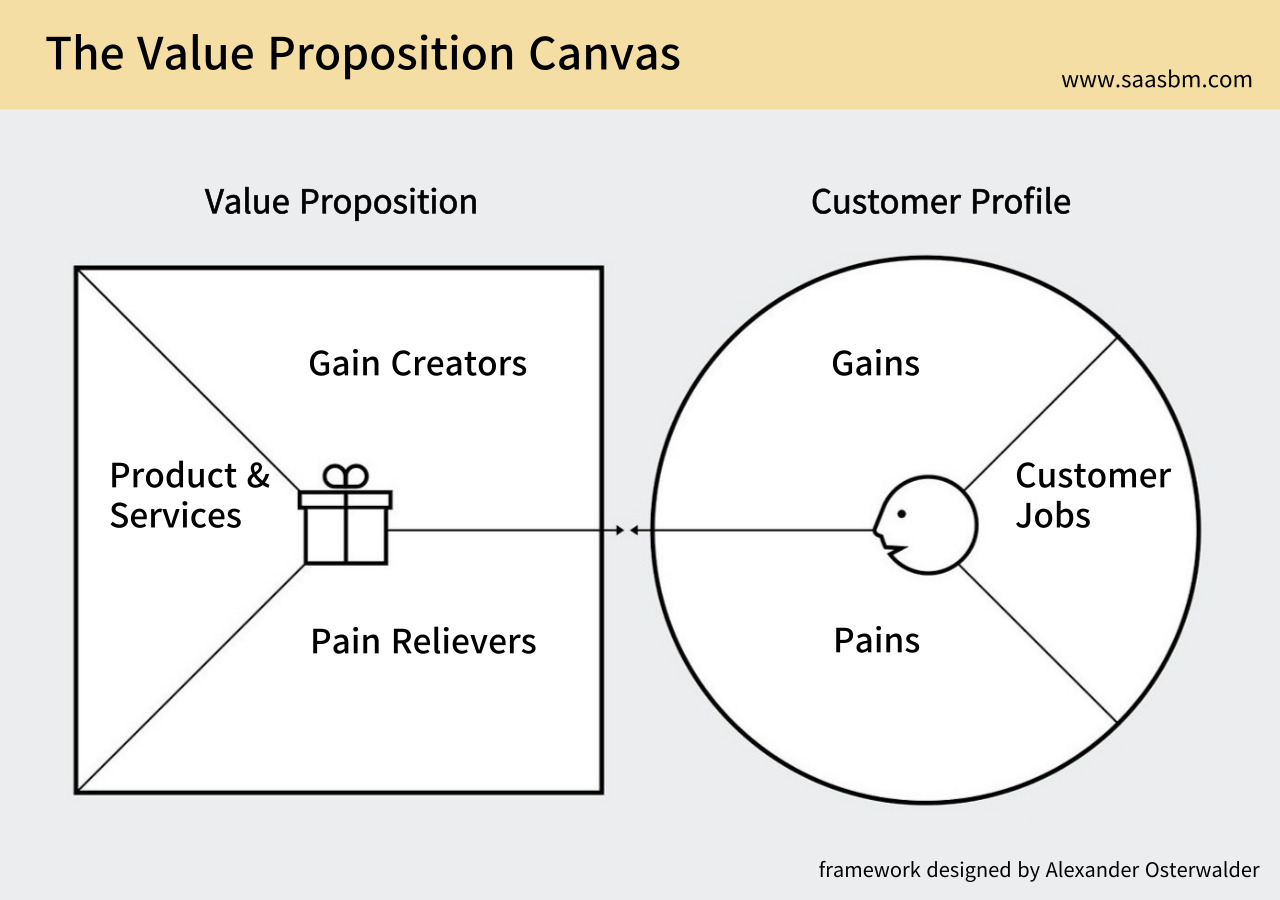
The Value Proposition Canvas helps systematically analyze customer needs, pain points, and expected gains, and how Databox’s features address these elements.
Customer Jobs
- Monitoring business KPIs across multiple platforms
- Creating regular performance reports for stakeholders
- Identifying trends and performance issues quickly
- Making data-driven decisions based on accurate metrics
- Tracking progress against business goals
Customer Pain Points
- Time wasted toggling between multiple analytics platforms
- Difficulty in creating consistent, visually appealing reports
- Delayed awareness of performance changes or problems
- Manual data aggregation leading to errors and inefficiency
- Lack of a unified view for cross-functional teams
Customer Gains
- Time savings through automated reporting
- Improved decision-making with real-time insights
- Better team alignment with shared dashboards
- Increased confidence in data accuracy
- Proactive performance management
Service Value Mapping
Databox directly addresses customer pain points through its core features: the extensive integration library eliminates toggling between platforms; pre-built templates and intuitive dashboard creation solve reporting difficulties; real-time data and alerts prevent delayed awareness of issues; automated data aggregation removes manual errors; and collaborative dashboards create unified views for teams. The platform delivers gains through scheduled reports (time savings), real-time data visualization (improved decision-making), shared access features (team alignment), standardized metrics (data confidence), and goal tracking with alerts (proactive management). This tight alignment between customer needs and Databox’s capabilities creates a compelling value proposition in the analytics platform market.
1.4 Jobs-to-be-Done Analysis
The Jobs-to-be-Done framework helps identify the fundamental reasons why customers “hire” Databox, the situations in which they use it, and their criteria for success.
Core Job
The primary job customers hire Databox to do is to transform fragmented data into actionable insights without extensive technical work. Functionally, they need to monitor performance metrics from multiple sources in one place, automate reporting processes, and get timely alerts about performance changes. Emotionally, they seek to reduce anxiety about missing important trends, gain confidence in presenting data to stakeholders, and feel in control of their business performance.
Job Context
This job occurs in several critical business situations: during weekly or monthly reporting cycles when teams need to compile performance updates; in executive meetings where cross-functional data needs to be presented coherently; when performance deviates from targets and quick identification is essential; and during strategy planning sessions requiring historical data analysis. The frequency is typically daily for monitoring and weekly/monthly for deeper analysis, with high importance as data-driven decision making becomes increasingly central to business operations.
Success Criteria
Customers evaluate Databox’s success by several key metrics: time saved on reporting (often 5+ hours per week); the comprehensiveness of data from their tech stack; the speed at which they can identify and address performance issues; the clarity of insights leading to better decisions; and positive feedback from stakeholders on the quality and accessibility of reports. The ultimate success metric is improved business performance resulting from faster, better-informed decisions.
2. Market Analysis
2.1 Market Positioning
Databox operates in a specific market segment with distinct characteristics related to market maturity and current industry trends.
- Service Category: Business Intelligence & Analytics for SMBs and Marketing Agencies – a specialized segment focused on making data analytics accessible to companies without dedicated data teams, with particular emphasis on marketing and sales performance tracking.
- Market Maturity: Growth stage – The BI and analytics market is well-established, but the segment targeting SMBs and non-technical users is still experiencing significant growth. Traditional BI solutions have catered to enterprise customers with technical resources, while Databox and similar solutions are democratizing access to analytics capabilities for smaller organizations.
- Market Trend Relevance: Databox aligns well with several key market trends, including the shift toward data democratization (making data accessible to non-technical users), integration-focused platforms (connecting disparate systems), the rise of no-code/low-code solutions, increasing importance of real-time monitoring, and the growing need for automated reporting to address efficiency challenges in businesses of all sizes.
The company has positioned itself at the intersection of business intelligence and marketing technology, focusing on ease of use rather than the advanced analytics capabilities that characterize enterprise-focused BI solutions. This positioning allows Databox to serve the growing market of data-driven SMBs and agencies that need analytics capabilities but lack technical resources.
2.2 Competitive Environment
The business analytics and dashboard market includes various competitors with different focuses and approaches, creating a dynamic competitive landscape.
- Major Competitors: Databox competes directly with Geckoboard, Klipfolio, Domo, Grow.com, and Google Data Studio (now Looker Studio). Each offers data aggregation and dashboard creation capabilities but with different strengths and target audiences.
- Competitive Landscape: The market is moderately fragmented, with competitors differentiating based on integration capabilities, ease of use, customization options, depth of analytics, and pricing. Enterprise-focused players like Tableau and Power BI represent the high end of the market with advanced capabilities at higher price points, while Databox occupies the middle market segment with balanced functionality and accessibility. The market continues to see innovation around AI-powered insights, data visualization techniques, and broader integration capabilities.
- Substitutes: Companies may use several alternatives instead of dedicated dashboard platforms like Databox: creating manual reports in Excel/Google Sheets; using built-in analytics within individual platforms (like HubSpot or Google Analytics); implementing custom dashboard solutions with development resources; or employing enterprise BI tools with broader capabilities but higher complexity and cost. Agency-specific reporting tools like AgencyAnalytics also serve as partial substitutes for specific customer segments.
The competitive environment requires Databox to maintain balance between simplicity and capability while continuously expanding integrations to maintain relevance as customers’ tech stacks evolve. The platform must also deliver sufficient value to justify its position as a dedicated solution versus the free or already-embedded alternatives that many businesses default to using.
2.3 Competitive Positioning Analysis
Mapping Databox and its competitors along key differentiation dimensions reveals distinct positioning strategies and competitive advantages.
Competitive Positioning Map
The competitive landscape can be visualized by mapping key players along two critical differentiation axes that reflect the most important considerations for customers in this market.
- X-axis: Technical Complexity (Low to High) – representing how much technical knowledge is required to implement and use the platform effectively
- Y-axis: Range of Functionality (Focused to Comprehensive) – representing the breadth of capabilities from specialized reporting to extensive analytics and data processing features
Positioning Analysis
By mapping competitors on these axes, we can identify their market positioning strategies and Databox’s competitive position:
- Domo: Positioned in the high functionality/moderate-to-high complexity quadrant, offering extensive enterprise-grade features but requiring more technical skill and investment.
- Google Looker Studio: Occupies the moderate functionality/moderate complexity space, offering robust capabilities at no cost but requiring some technical knowledge for advanced customization.
- Geckoboard: Positioned in the low complexity/focused functionality quadrant, emphasizing simplicity and quick deployment for specific use cases.
- Klipfolio: Sits in the moderate-to-high functionality/moderate complexity area, offering deeper customization options but with a steeper learning curve than Databox.
- Databox: Occupies a strategic position in the moderate functionality/low complexity quadrant, differentiating itself by balancing comprehensive integration capabilities and dashboard features with an intuitive interface that requires minimal technical expertise. This positioning appeals directly to SMBs and agencies that need powerful analytics without dedicated data teams.
This positioning map reveals that Databox has carved out a valuable middle ground in the market. Unlike enterprise solutions that offer extensive capabilities but significant complexity, or simplified tools with limited functionality, Databox delivers substantial analytical capabilities in an accessible package. This strategic positioning addresses the growing segment of data-conscious businesses that need analytics power without technical overhead, and represents one of the company’s key competitive advantages.
3. Business Model Analysis
3.1 Revenue Model
Databox employs a tiered subscription model with clearly defined value steps between pricing tiers to monetize its platform effectively.
- Revenue Structure: Databox uses a freemium subscription model with tiered pricing based on features, integration capacity, and user access. The core business model follows the typical SaaS subscription approach with monthly or annual billing options, with discounts (approximately 20%) for annual commitments.
- Pricing Strategy: The pricing structure includes four main tiers: Free, Starter ($59/month), Professional ($135/month), and Enterprise (custom pricing). Each tier increases limits on databoards (dashboards), data sources, users, and adds features like white labeling, API access, and advanced security. This creates clear upgrade paths as customers’ needs grow. Databox also offers specific agency plans designed for companies managing multiple client accounts.
- Free Offering Scope: The free plan includes core functionality with limitations: 3 data source connections, limited historical data, basic dashboard capabilities, and essential alerts. This provides genuine value to users while maintaining clear incentives to upgrade as their needs expand. The free tier serves both as a customer acquisition channel and allows small businesses with minimal needs to derive value.
Databox’s revenue model balances accessibility with sustainable monetization by providing clear value increments at each price tier. The focus on annual subscriptions helps improve cash flow predictability and reduce churn risk. For agencies and multi-brand companies, the platform offers specialized pricing that accounts for the multi-client usage pattern, creating alignment between the value received and price paid by this important customer segment. The strategic limitation of connections and features in lower tiers creates natural expansion opportunities as customers grow their data needs.
3.2 Customer Acquisition Strategy
Databox employs a multi-channel acquisition strategy focused on inbound marketing and product-led growth to attract and onboard users efficiently.
- Core Acquisition Channels: Databox relies heavily on content marketing (blog, SEO, templates library) to attract users searching for analytics solutions. The company also leverages partnerships with platforms they integrate with (like HubSpot), creates educational webinars, maintains active social media presence, and uses targeted advertising. Their extensive template library serves as both a marketing asset and value-add, drawing potential users through practical resources.
- Sales Model: Databox primarily uses a product-led growth approach with self-service sign-up for free and lower-tier plans, supplemented by an inside sales team for larger accounts and Enterprise customers. The sales approach is consultative rather than aggressive, focusing on helping prospects understand how the platform addresses their specific reporting challenges.
- User Onboarding: The onboarding experience begins with template selection and data source connection, providing immediate value through pre-built dashboards. Interactive guidance, onboarding checklists, and setup wizards help users configure their initial dashboards. For higher-tier customers, Databox offers personalized onboarding sessions to accelerate time-to-value. The platform emphasizes quick wins by making the initial dashboard creation process as frictionless as possible.
Databox’s acquisition model intelligently balances self-service and high-touch approaches based on customer potential. The free tier and template library serve as efficient top-of-funnel mechanisms that allow prospects to experience value before committing financially. Meanwhile, the inside sales team focuses resources on higher-value prospects who require more consultation. This hybrid approach optimizes customer acquisition cost while maintaining the personalized guidance necessary for complex use cases and larger accounts. The emphasis on initial quick wins and template-first onboarding addresses the critical challenge of activation – getting users to experience the core value proposition rapidly.
3.3 SaaS Business Model Canvas
The Business Model Canvas framework provides a systematic analysis of Databox’s entire business structure, highlighting the interconnections between different elements of its operation.
Value Proposition
Unified business dashboard platform that consolidates metrics from 70+ data sources into real-time, customizable visualizations with automated reporting capabilities, saving hours of manual reporting work.
Customer Segments
SMBs with marketing and sales operations; digital marketing agencies managing multiple clients; data-driven teams without technical resources; managers needing regular performance reports.
Channels
Website and content marketing; integration marketplace listings; partner referrals; template library; webinars and educational content; freemium product access; inside sales for enterprise.
Customer Relationships
Self-service for free and lower tiers; automated onboarding sequences; dedicated account management for enterprise; community support forums; regular product education webinars; email engagement sequences.
Revenue Streams
Tiered subscription model with monthly/annual billing; premium features for higher tiers; agency-specific packages; enterprise custom pricing; potential future data enrichment and insights services.
Key Resources
Technology platform and integration library; dashboard templates database; customer success team; engineering talent; sales and marketing team; investor capital; brand reputation in analytics space.
Key Activities
Platform development and maintenance; expanding integration library; creating templates and educational content; customer onboarding and support; sales and marketing; continuous product improvement.
Key Partnerships
Integration partners (HubSpot, Google, etc.); technology infrastructure providers; marketing agencies as customers/resellers; complementary SaaS tools; industry associations.
Cost Structure
Engineering and product development; cloud infrastructure; customer support; sales and marketing; administrative operations; integration maintenance; content creation.
Business Model Analysis
Databox’s business model demonstrates several strengths: the freemium approach creates an efficient acquisition funnel; the value proposition directly addresses clear market pain points; the extensive integration library creates significant switching costs once customers are established; and the tiered pricing structure enables revenue growth aligned with customer value received. The model also benefits from the network effects of templates and integrations – each new connector and template makes the platform more valuable to all users.
Potential vulnerabilities include dependency on third-party platforms for integrations, which creates maintenance overhead and potential disruption if APIs change; relatively low barriers to entry for competitors to create similar dashboarding solutions; and the challenge of serving diverse customer needs with a unified product. The business model’s sustainability relies heavily on maintaining integration quality, continuing to simplify complex data visualization problems, and creating sufficient customer stickiness to justify subscription renewal despite the presence of free alternatives.
4. Product Analysis
4.1 Core Feature Analysis
Databox offers a comprehensive set of features organized around data consolidation, visualization, and performance monitoring, with certain capabilities that set it apart from competitors.
- Major Feature Categories: Databox’s functionality can be grouped into five main categories: Data Integration (connectors to 70+ platforms); Dashboard Creation (databoards with customizable visualizations); Automated Reporting (scheduled emails, snapshots); Performance Monitoring (alerts, goals tracking); and Collaboration Tools (annotations, user permissions, sharing).
- Key Differentiating Features: Databox distinguishes itself through several unique capabilities: Datablock technology (modular visualization components that can be customized and combined); Scorecard feature (summary view of KPIs with performance indicators); Goals Tracking with automatic progress calculation; Daily Scorecards (automated performance summaries via email/mobile); and Query Builder (no-code custom metric creation).
- Functional Completeness: Compared to competitors, Databox offers extensive integration coverage that matches or exceeds most direct competitors in its market segment. Its visualization capabilities are robust for common business metrics, though not as advanced as enterprise BI tools. The platform excels in ease-of-use and pre-built content, making it more immediately useful than tools requiring more configuration. However, it has more limited data manipulation capabilities than higher-end analytics platforms.
The product’s strength lies in striking an effective balance between power and usability. For instance, the Datablock technology allows users to create sophisticated visualizations without technical skills, while the Query Builder enables custom metric creation without SQL knowledge. This approach makes advanced analytics accessible to business users who would otherwise rely on basic spreadsheet reporting or disjointed platform-specific dashboards.
The platform’s template-driven approach deserves special mention as both a product and marketing differentiator. By offering hundreds of pre-built templates for common use cases across different industries and platforms, Databox dramatically reduces the time-to-value for new users. This template library continues to expand, creating additional value for the ecosystem and raising switching costs for established customers.
4.2 User Experience
Databox’s user experience is designed to make data analysis accessible to non-technical users while still providing sufficient depth for more advanced use cases.
- UI/UX Characteristics: The interface employs a clean, minimalist design with a focus on visual clarity and intuitive navigation. The dashboard editor uses a drag-and-drop approach with grid layouts, allowing users to arrange visualizations without complex configuration. Color is used functionally to indicate performance (green/red for above/below targets), and the mobile experience is fully responsive. The design philosophy prioritizes immediate comprehension of data over visual complexity.
- User Journey: The primary user flow begins with selecting a template or starting a blank dashboard, connecting data sources through guided wizards, customizing visualizations with the block editor, setting goals and alerts for metrics, scheduling automated reports, and sharing dashboards with stakeholders. Secondary workflows include creating annotations on trends, drilling down into metric details, and adjusting time periods for analysis.
- Accessibility and Ease of Use: Databox scores highly on ease of use relative to competing platforms, with most users able to create their first meaningful dashboard within an hour of signup. The learning curve is intentionally shallow for basic functions, with complexity increasing only for advanced features like custom metrics and calculated fields. The platform is accessible across devices, with dedicated mobile apps complementing the web experience.
A key UX strength is the platform’s thoughtful progressive disclosure of functionality – basic features are immediately accessible, while more advanced capabilities reveal themselves as users become more proficient. This approach prevents overwhelming new users while ensuring power users can access deeper functionality as needed.
The notification and alerting system represents another important UX element. By allowing users to set thresholds on metrics and receive proactive alerts (via email, Slack, or mobile), Databox transforms from a passive reporting tool to an active performance management system. This capability directly addresses the common pain point of discovering issues too late, and represents a significant user experience advantage over more static dashboard platforms.
4.3 Feature-Value Mapping Analysis
This analysis maps Databox’s key features to the specific customer value they deliver, and assesses the level of differentiation from competitors.
| Core Feature | Customer Value | Differentiation Level |
|---|---|---|
| Data Connectors (70+) | Eliminates manual data aggregation from multiple platforms, saving hours of work weekly and providing a unified view of performance across the organization’s tech stack. | Medium |
| Datablock Builder | Enables non-technical users to create professional visualizations without design skills or developer assistance, democratizing data access across organization roles. | High |
| Template Gallery | Drastically reduces dashboard setup time from hours to minutes, providing immediate value through industry-specific best practices and proven reporting frameworks. | High |
| Scheduled Reports | Automates the distribution of insights to stakeholders on a consistent schedule, ensuring regular data-driven discussions without manual report creation. | Medium |
| Goals & Alerts | Transforms passive dashboards into proactive management tools by instantly notifying teams when metrics deviate from targets, reducing response time to issues. | Medium |
| Custom Metrics (Query Builder) | Allows users to create bespoke calculations and metrics without SQL knowledge, enabling unique business measurements that cross platform boundaries. | High |
| Mobile Experience | Enables decision makers to stay connected to critical metrics regardless of location, supporting timely interventions and continuous performance awareness. | Medium |
Mapping Analysis
The feature-value mapping reveals that Databox’s strongest differentiation comes from features that make complex data tasks accessible to non-technical users. The Datablock Builder, Template Gallery, and Query Builder represent the highest differentiation areas, all centered around the theme of simplifying what would otherwise be technical or time-consuming processes. These features directly address the main pain points of the target audience: limited technical resources, time constraints, and the need for consistent, professional reporting.
While some features like connectors and scheduled reports show medium differentiation (as most competitors offer similar capabilities), Databox’s implementation emphasizes ease of use and rapid setup, aligning with their overall value proposition. The competitive advantage comes not just from the features themselves, but from how they’re implemented with the non-technical user in mind.
Potential improvement opportunities exist in further enhancing the alerting system with AI-driven anomaly detection (rather than just threshold-based alerts) and expanding the custom metrics capability to include more advanced statistical functions. These enhancements would strengthen Databox’s position against both simpler visualization tools and more complex analytics platforms.
5. Growth Strategy Analysis
5.1 Current Growth Status
Databox is currently positioned in a strategic phase of its growth trajectory, with clear indicators of its product lifecycle position and primary growth drivers.
- Growth Stage: Databox appears to be in the growth-to-maturity transition phase of the product lifecycle. Having established product-market fit and a stable platform with substantial integration capabilities, the company is now focused on scaling customer acquisition and expanding platform capabilities rather than fundamental pivots or market validation. The product has moved beyond early adoption into broader market acceptance, particularly in marketing analytics and agency segments.
- Expansion Direction: The company demonstrates a dual expansion approach: deepening value for current customer segments through enhanced features and integrations (vertical expansion), while simultaneously broadening appeal to adjacent segments like sales operations and financial teams (horizontal expansion). This balanced approach leverages existing strengths while gradually extending into related use cases.
- Growth Drivers: Several key factors are currently driving Databox’s growth: the expanding ecosystem of SaaS tools creating greater need for unified dashboards; increasing pressure on marketing and sales teams to demonstrate ROI; growing adoption of data-driven operations in SMBs; the template marketplace creating network effects; and partnerships with integrated platforms that serve as customer acquisition channels.
The company’s current growth strategy appears to prioritize sustainable expansion over rapid scaling, with focus on improving product stickiness and expanding use cases within existing customer organizations. This approach is evident in product development patterns that emphasize enhancing core functionality and improving user experience rather than pursuing dramatic features aimed at new market segments.
Databox’s position in the growth-to-maturity transition presents both opportunities and challenges. The established platform provides a solid foundation for expansion, but increasing competition in the business intelligence space demands continuous innovation to maintain differentiation. The company’s focus on ease of use and pre-built content represents a defensible position that aligns with the needs of its target market segment.
5.2 Expansion Opportunities
Databox has several promising avenues for expansion across product features, market segments, and revenue streams that could drive future growth.
- Product Expansion Opportunities: Databox could enhance its platform through AI-powered insights that automatically identify trends and anomalies; deeper data analysis capabilities beyond visualization; expanded collaboration features for cross-functional teams; more advanced data transformation tools for complex metrics; and industry-specific solutions with specialized metrics and visualizations for verticals like ecommerce, SaaS, or healthcare.
- Market Expansion Opportunities: Potential market growth areas include moving upmarket to serve larger enterprises with more complex reporting needs; geographic expansion to international markets with localized templates and integrations; targeting specific verticals with dedicated marketing and specialized features; expanding from marketing to broader business operations teams; and developing stronger agency offerings with multi-client management capabilities.
- Revenue Expansion Opportunities: Additional revenue streams could include premium data enrichment services that enhance customer data with external sources; advanced analytics as paid add-ons; custom template development services; consultative services for complex reporting needs; and a marketplace for third-party template creators with revenue sharing mechanisms.
The product expansion into AI-assisted analytics represents a particularly promising direction, as it would address the growing challenge of data interpretation rather than just visualization. For example, automatically identifying correlations between metrics or detecting unusual patterns could provide significant additional value to customers who lack data science resources.
In terms of market expansion, the agency segment offers substantial growth potential through specialized features for client management, white-labeling, and multi-account reporting. Agencies often serve as multipliers, with each new agency account potentially representing multiple end-client dashboards. This creates an efficient customer acquisition channel with higher lifetime value potential.
5.3 SaaS Expansion Matrix
The SaaS Expansion Matrix provides a structured analysis of Databox’s growth paths, identifying priority directions based on feasibility and potential impact.
Vertical Expansion (Vertical Expansion)
Definition: Providing deeper value to existing customer segments
Potential: High
Strategy: Databox can deepen value for current customers by expanding analytics capabilities (advanced calculations, statistical analysis), enhancing collaboration features (comments, annotations, approvals), developing more specialized templates for existing integration partners, creating industry benchmarking capabilities, and implementing AI-driven insights to highlight significant findings without manual analysis. These enhancements leverage the existing user base while increasing product stickiness and average revenue per account.
Horizontal Expansion (Horizontal Expansion)
Definition: Expanding to similar customer segments
Potential: Medium
Strategy: Databox can expand horizontally by targeting adjacent departments within customer organizations (sales, finance, operations), developing specific solutions for complementary roles like CFO or COO dashboards, creating cross-functional reporting solutions that tie marketing outcomes to financial results, building integrations with ERP and operational systems, and developing specialized template sets for new use cases like ecommerce performance or customer success metrics.
New Market Expansion (New Market Expansion)
Definition: Expanding to entirely new customer segments
Potential: Low-Medium
Strategy: For new market expansion, Databox could consider developing enterprise-focused features with enhanced security and governance, creating specialized vertical solutions for industries like healthcare or education, pursuing geographic expansion with localized language support and region-specific integrations, building dedicated solutions for specific business models (franchise operations, multi-location businesses), or creating simplified solutions for very small businesses with fewer data sources but basic reporting needs.
Expansion Priorities
Based on Databox’s current position and capabilities, the most promising expansion paths can be prioritized:
- Vertical Expansion – AI-powered insights and analytics: This represents the highest priority opportunity as it leverages existing customers, increases product differentiation, and addresses the growing need for interpretation beyond visualization. This direction builds on Databox’s core strength of making complex data accessible without adding significant complexity.
- Horizontal Expansion – Cross-functional reporting: Creating solutions that connect marketing/sales data with financial outcomes offers significant value by bridging departmental silos. This approach expands usage within existing customer organizations without requiring entirely new market entry.
- Vertical Expansion – Agency-specific enhancements: Building deeper capabilities for the agency segment through improved client management, automated reporting, and white-labeling represents a focused opportunity with multiplier effects, as each agency can bring multiple client accounts.
6. SaaS Success Factors Analysis
6.1 Product-Market Fit
Databox’s alignment with market needs can be assessed across several key dimensions of product-market fit.
- Problem-Solution Fit: Databox addresses a significant and persistent problem in business operations – the fragmentation of performance data across multiple platforms. The solution effectively consolidates this data into unified dashboards that provide comprehensive visibility. The problem’s importance has increased as companies adopt more specialized SaaS tools, each with its own analytics, creating greater fragmentation. Databox’s approach of focusing on accessibility and ease of use (rather than advanced analytics complexity) matches well with the needs of SMBs and agencies that lack dedicated data teams.
- Target Market Fit: The selection of small-to-medium businesses and marketing agencies as primary targets represents a strategic choice that aligns with the product’s capabilities. These segments typically have sufficient data complexity to need a unified solution, but lack the resources for enterprise BI implementations or custom development. The product’s feature set and pricing structure are appropriately calibrated for these segments, offering meaningful value at an accessible price point relative to the alternatives.
- Market Timing: Databox’s market entry and evolution have coincided with several favorable timing factors: the proliferation of marketing and sales SaaS tools creating data silos; increasing pressure on marketing teams to demonstrate ROI; growing data literacy in SMBs creating demand for better visualization; and the shift toward remote work increasing the need for accessible dashboards. The timing is particularly advantageous as companies seek to optimize existing operations and gain efficiency from their current tech stack rather than adding new operational tools.
The product-market fit assessment reveals strong alignment between Databox’s capabilities and market needs, particularly in its chosen segments. The company has correctly identified that most businesses don’t primarily need more advanced analytics capabilities, but rather more accessible ways to visualize and act on the data they already have. This insight has guided product development toward simplification and integration rather than competing on advanced analytics features with enterprise platforms.
The strength of this product-market fit is evident in the platform’s growing template library, which effectively codifies common reporting needs across different business functions and tools. Each new template represents validated market demand for specific types of insights, creating a virtuous cycle where user needs directly inform product development.
6.2 SaaS Key Metrics Analysis
Analysis of key operational metrics reveals important insights about Databox’s execution and potential for sustainable growth.
- Customer Acquisition Efficiency: Databox’s customer acquisition approach demonstrates favorable efficiency characteristics through several elements: the freemium model creates a self-qualification mechanism where prospects can evaluate value before sales involvement; the template library serves dual purpose as both marketing asset and product feature, attracting organic traffic while demonstrating immediate value; partnerships with integrated platforms (like HubSpot) create efficient referral channels; and the product-led growth approach reduces dependency on sales resources for smaller accounts. These factors likely contribute to reasonable customer acquisition costs relative to customer lifetime value.
- Customer Retention Factors: Several aspects of Databox’s product create stickiness that supports retention: data integration work represents significant customer investment that creates switching costs; user-created custom dashboards and metrics become valuable assets that would need recreation elsewhere; scheduled reports create organizational dependencies as stakeholders become accustomed to receiving them; and the platform becomes more valuable over time as historical data accumulates. These elements likely contribute to healthy retention rates, particularly after customers have fully implemented their dashboards.
- Revenue Expansion Potential: Databox has multiple pathways for expanding revenue from existing customers: tier upgrades as companies grow and require more databoards or users; expansion to additional departments creating need for more connections; addition of new data sources as customer tech stacks evolve; upselling of agency customers as they add clients; and potential premium feature adoption as advanced capabilities are introduced. The pricing model is structured to align revenue growth with increased value delivery, creating natural expansion opportunities.
These operational metrics suggest a financially healthy SaaS model with sustainable unit economics. The freemium approach creates efficient top-of-funnel customer acquisition, while the product’s integration and customization elements build significant switching costs that support retention. The expansion potential is particularly strong with agency customers, who may increase usage substantially as they add clients without proportional support costs.
One potential area of concern is the initial activation period, as dashboard setup requires some customer effort before value is realized. The template library partially addresses this challenge, but continued investment in streamlining the time-to-value would further improve conversion from free to paid tiers and early retention metrics.
6.3 SaaS Metrics Evaluation
Estimating and evaluating key SaaS business metrics provides insight into Databox’s economic health and sustainability.
Customer Acquisition Cost (CAC)
Estimate: Medium
Rationale: Databox’s CAC is likely in the medium range for SaaS businesses in its category. The company employs efficient acquisition channels like content marketing, SEO, and product-led growth, which typically yield lower acquisition costs than heavy outbound sales. However, the specialized nature of the product requires targeting specific decision-makers with analytics needs, which increases targeting costs compared to more horizontal tools. The freemium model helps qualify leads, but also requires supporting many free users who never convert to paid.
Industry Comparison: Databox’s CAC is likely lower than enterprise BI platforms that require extensive sales cycles, but somewhat higher than mass-market SaaS tools with broader appeal. The focused nature of the platform requires specific marketing messaging and targeting.
Customer Lifetime Value (LTV)
Estimate: Medium-High
Rationale: Several factors suggest a healthy LTV: significant switching costs once dashboards are configured; expansion potential as organizations grow their data needs; relatively high value proposition compared to manual reporting alternatives; and strategic pricing that aligns with value delivery. For agency customers, LTV is likely particularly strong as they add clients and expand usage. The annual subscription option also improves retention by reducing evaluation frequency.
Industry Comparison: Databox likely achieves better LTV than purely visualization tools with less integration depth, but lower than enterprise platforms with extensive customization and organization-wide deployment. For its target segment, the LTV appears competitive and sufficient to support a sustainable business model.
Churn Rate
Estimate: Low-Medium
Rationale: Once customers have fully implemented Databox dashboards and integrated them into regular workflows, churn risk decreases significantly due to switching costs and established usage patterns. Initial churn may be higher during the activation period before users have fully configured their dashboards. Agency customers likely have particularly low churn once they’ve set up client reporting workflows.
Industry Comparison: Databox likely achieves better retention than simple visualization tools that are easily replaceable, but may experience higher initial churn than products with even faster time-to-value. The overall rate is probably favorable compared to industry averages for analytics platforms serving SMB markets.
LTV:CAC Ratio
Estimate: Approximately 3:1 to 4:1
Economic Analysis: This estimated ratio suggests a sustainable business model with sufficient margin to fund both growth and ongoing operations. The combination of reasonable acquisition costs and strong retention creates healthy unit economics. For agency customers, the ratio is likely even more favorable due to their higher expansion potential and lower relative support costs.
Improvement Opportunities: The ratio could be further improved through: enhancing onboarding to reduce early churn; developing more industry-specific templates to improve conversion rates; creating additional upsell opportunities through premium features; optimizing the self-service purchase path to reduce sales touch where not necessary; and enhancing agency-specific capabilities to attract more of these high-LTV customers.
7. Risk and Opportunity Analysis
7.1 Key Risks
Databox faces several significant risks across different dimensions of its business that could impact its long-term success in the competitive business analytics market.
- Market Risks: The business analytics market is becoming increasingly saturated with both established players and new entrants offering similar dashboard solutions. The market is also experiencing rapid technological change with the rise of AI-powered analytics, which could make current dashboard visualization approaches obsolete if Databox doesn’t evolve quickly enough. Additionally, economic downturns often lead companies to cut spending on analytics tools, making Databox vulnerable to macroeconomic conditions as a non-essential business tool.
- Competitive Risks: Databox faces intense competition from larger players with more resources (like Tableau, Microsoft Power BI, Google Data Studio) who can outspend them on R&D and marketing. These competitors are increasingly bundling analytics capabilities with their broader product suites at competitive prices, potentially squeezing Databox’s market share. There’s also the threat of disruptive new entrants who might offer more innovative or specialized analytics solutions at lower price points, particularly those leveraging advanced AI capabilities.
- Business Model Risks: Databox’s subscription-based model requires continuous customer renewal to maintain revenue, making customer retention and reducing churn critical challenges. The multi-tiered pricing approach, while flexible, creates potential revenue instability if customers primarily opt for lower-tier plans. Additionally, Databox’s value proposition is heavily dependent on maintaining a large number of data source integrations (70+), creating significant technical debt and maintenance overhead as APIs change.
These risks create a challenging landscape for Databox as it must simultaneously defend its current market position while also evolving its product to address emerging technologies and changing customer expectations. The platform’s heavy reliance on third-party integrations also creates technical vulnerabilities that require constant management to ensure service reliability. If Databox fails to address these risks proactively, it could face increasing customer churn and diminishing market relevance in the rapidly evolving data analytics space.
7.2 Growth Opportunities
Despite the challenges, Databox is well-positioned to capitalize on several growth opportunities that align with emerging market trends and customer needs in the business analytics space.
- Short-term Opportunities: Databox can immediately expand its vertical-specific dashboard templates and pre-built metrics to address the unique needs of additional industries beyond its current focus areas. Enhancing mobile experiences and alerts would capitalize on the growing demand for on-the-go analytics access. The platform could also quickly implement deeper data storytelling features that help users better understand and communicate insights, moving beyond simple visualization to guided analysis.
- Mid to Long-term Opportunities: Over the next 1-3 years, Databox should invest in developing AI-powered analytics capabilities that automatically surface insights and anomalies without manual user analysis. Building dedicated enterprise solutions with enhanced security, compliance features, and professional services would allow penetration into larger, more profitable market segments. Additionally, creating an analytics app marketplace where third-party developers can build specialized analytics applications on top of the Databox platform could create a powerful ecosystem effect.
- Differentiation Opportunities: Databox has the potential to establish a unique market position by focusing on the non-technical business user with an extremely intuitive, jargon-free interface combined with intelligent guidance features that help users understand what metrics matter most for their specific business objectives. This approach would distinguish Databox from competitors that often require technical expertise or data analysis knowledge.
To capitalize on these opportunities, Databox should pursue a strategic approach that balances short-term feature enhancements with longer-term platform evolution. The company should deepen its understanding of specific vertical markets to create truly tailored solutions while simultaneously investing in AI capabilities that will form the foundation of next-generation analytics. By combining user-friendly design with increasingly intelligent insights, Databox can carve out a sustainable competitive position even against larger competitors with more resources. The key to success will be maintaining focus on specific high-value market segments rather than attempting to compete broadly against enterprise analytics platforms on all fronts.
7.3 SWOT Analysis
This SWOT analysis provides a structured examination of Databox’s internal strengths and weaknesses alongside external opportunities and threats to identify strategic priorities.
Strengths
- Extensive integration ecosystem with 70+ data sources giving users comprehensive data access
- User-friendly interface designed for non-technical business users
- Flexible dashboard customization and white-labeling capabilities
- Strong mobile experience with dedicated apps for on-the-go analytics
Weaknesses
- Limited advanced analytics and predictive capabilities compared to enterprise competitors
- Potential resource constraints as a smaller player competing against tech giants
- High technical maintenance burden from supporting numerous third-party integrations
- Less established brand recognition in the crowded analytics market
Opportunities
- Growing demand for business intelligence tools among SMBs without dedicated data teams
- Increasing focus on data-driven decision making across organizations of all sizes
- Emergence of AI as a differentiator in analytics that could level the playing field
- Vertical-specific analytics solutions for underserved industry segments
Threats
- Rapid marketplace consolidation as larger platforms acquire innovative analytics startups
- Commoditization of basic dashboard functionality driving prices down
- Increasing complexity of data privacy regulations across regions
- Potential for tech giants to bundle analytics capabilities into existing product suites
SWOT-Based Strategic Directions
- SO Strategy: Leverage Databox’s user-friendly interface and extensive integrations to expand into industry verticals with growing SMBs that need accessible analytics but lack technical expertise. Create industry-specific templates and metrics that deliver immediate value.
- WO Strategy: Invest in developing AI-powered analytics capabilities to overcome the limitations in advanced analytics while taking advantage of the growing demand for intelligent insights that don’t require data science expertise.
- ST Strategy: Differentiate from commoditized dashboard offerings by enhancing customization capabilities and focusing on collaborative features that embed analytics into daily workflow, making the platform sticky and resistant to price competition.
- WT Strategy: Develop a more focused product strategy that prioritizes excellence in specific high-value use cases rather than competing broadly. Consider strategic partnerships with complementary software providers to expand market reach without stretching internal resources.
8. Conclusions and Insights
8.1 Comprehensive Assessment
Databox demonstrates a solid foundation as a business analytics platform, with several key elements contributing to its overall market position and future outlook.
- Business Model Sustainability: Databox’s subscription-based revenue model provides predictable, recurring revenue with tiered pricing that captures value across different customer segments. The freemium approach serves as an effective customer acquisition funnel while the platform’s focus on reducing reporting friction addresses a genuine market need. The business model appears sustainable, though margin pressure from increasing competition and ongoing integration maintenance costs could present challenges to long-term profitability without continued product differentiation.
- Market Competitiveness: In the crowded business analytics landscape, Databox has carved out a competitive position through its focus on accessibility for non-technical users and comprehensive integrations. While it faces significant competition from both established enterprise players and newer analytics startups, Databox’s emphasis on simplifying complex data for everyday business users gives it a defensible market position. However, its competitive standing will require ongoing reinforcement through continued product innovation and strategic positioning against larger competitors with more resources.
- Growth Potential: Databox shows promising growth potential, particularly in the expanding market of SMBs increasingly adopting data-driven approaches. The platform’s combination of usability and integration breadth positions it well to capture value from this growing segment. Additional growth vectors include vertical-specific solutions, enhanced AI capabilities, and potential expansion upmarket with more sophisticated enterprise features. Realizing this potential will require disciplined execution and strategic focus on the most promising market segments rather than trying to compete across all fronts simultaneously.
Overall, Databox demonstrates a viable business with realistic growth prospects in the business analytics space. Its greatest strength lies in making data analytics accessible to business users without technical expertise, addressing a significant market need. While the competitive landscape presents challenges, Databox’s focused approach and user-centric design philosophy provide a foundation for sustainable growth if the company continues to innovate and adapt to evolving market needs. The platform’s future success will largely depend on how effectively it balances product expansion with maintaining its core value proposition of simplicity and accessibility while strategically selecting which capabilities to develop in-house versus which to address through partnerships or integrations.
8.2 Key Insights
Our analysis of Databox reveals several critical insights that define its current position and future potential in the business analytics marketplace.
Key Strengths
- Databox excels at democratizing data access through an exceptionally user-friendly interface that doesn’t require technical expertise, making analytics accessible to everyday business users across organizations.
- The platform’s extensive integration ecosystem (70+ data sources) creates significant value by centralizing disparate data sources into cohesive dashboards, addressing a fundamental pain point for modern businesses managing multiple digital tools.
- Databox’s flexible customization capabilities combined with automated reporting features substantially reduce the time burden of regular business reporting, creating tangible efficiency benefits that justify its subscription costs.
Key Challenges
- Maintaining competitive differentiation in an increasingly crowded analytics market where basic dashboard functionality is becoming commoditized requires continuous innovation to avoid price pressure.
- Balancing product depth versus breadth presents difficult strategic choices about which features to prioritize, particularly given resource constraints compared to larger competitors.
- Adapting to the rapidly evolving AI analytics landscape without losing focus on core usability advantages will require careful technology investments and potential partnership strategies.
Core Differentiation Factor
Databox’s fundamental differentiation lies in its ability to transform complex business data into actionable insights for non-technical decision-makers through a combination of extensive integrations, intuitive visualization, and automated analysis capabilities. Unlike many competitors that either target technical users or offer limited data source connections, Databox bridges the gap between comprehensive data access and everyday business usability. This positioning addresses the growing need for data democratization across organizations while avoiding direct competition with enterprise-focused analytics platforms that require dedicated data teams to implement and maintain.
8.3 SaaS Scorecard
This quantitative assessment evaluates Databox across five critical success factors on a 1-5 scale to provide an objective measure of the platform’s overall competitiveness.
| Assessment Category | Score (1-5) | Evaluation |
|---|---|---|
| Product Capability | 4 | Databox offers robust dashboard creation, visualization, and reporting capabilities with an exceptionally user-friendly interface. While it lacks some of the advanced analytics features of enterprise platforms, its core functionality effectively meets the needs of its target market. |
| Market Fit | 4 | The platform addresses a clear market need for simplified business analytics among SMBs and non-technical users. Its current positioning aligns well with growing demand for accessible data tools, though it could further enhance its market fit with deeper vertical-specific solutions. |
| Competitive Positioning | 3 | Databox has established a defensible position in the business analytics space through its user-friendly approach and integration breadth. However, it faces significant competitive pressure from both larger enterprise players and newer analytics startups targeting similar segments. |
| Business Model | 4 | The subscription-based revenue model with tiered pricing creates sustainable, predictable revenue streams. The freemium approach effectively supports customer acquisition, though the company may face challenges maintaining margins amid competitive pricing pressure. |
| Growth Potential | 4 | Databox shows strong growth potential through several vectors: vertical expansion, enhanced AI capabilities, and potential upmarket movement. The expanding market for business analytics and increasing emphasis on data-driven decision making create favorable conditions for continued growth. |
| Total Score | 19/25 | Strong |
With a total score of 19/25, Databox demonstrates strong overall competitiveness in the business analytics SaaS market. The platform performs particularly well in product capability, market fit, and business model categories, reflecting its effective focus on making data analytics accessible to non-technical users through an intuitive interface and comprehensive integrations. The slightly lower score in competitive positioning acknowledges the challenges of competing in a crowded marketplace with larger, better-resourced competitors. To maintain and improve its strong position, Databox should continue enhancing its core differentiation around usability while strategically adding capabilities that address evolving customer needs, particularly in AI-powered insights and industry-specific analytics. With disciplined execution and strategic focus, Databox has the potential to strengthen its market position and accelerate growth despite competitive pressures.
9. Reference Sites
9.1 Analyzed Service
The official website of Databox, the subject of this analysis.
- Official Website: https://databox.com/ – Databox’s main website showcasing their business analytics platform that connects to 70+ data sources and provides customizable dashboards for performance monitoring and reporting.
9.2 Competitive/Similar Services
Key services that compete with or offer similar functionality to Databox in the business analytics space.
- Tableau: https://www.tableau.com/ – A more enterprise-focused data visualization platform with deeper analysis capabilities, though typically requiring more technical expertise than Databox.
- Power BI: https://powerbi.microsoft.com/ – Microsoft’s business analytics service offering rich visualizations and integrations with Microsoft products, positioned as a more comprehensive but complex alternative.
- Google Data Studio: https://datastudio.google.com/ – A free data visualization tool with strong Google ecosystem integration but more limited third-party connections compared to Databox.
- Klipfolio: https://www.klipfolio.com/ – A close competitor with similar dashboard capabilities and integration focus, targeting similar customer segments as Databox.
9.3 Reference Resources
Useful resources for understanding or building a similar SaaS business in the analytics space.
- G2 Business Intelligence Software Category: https://www.g2.com/categories/business-intelligence – Comprehensive overview of business intelligence software landscape with user reviews and category comparisons.
- Amplitude Product Analytics: https://amplitude.com/ – Valuable reference for product analytics implementation that could inform dashboard development for SaaS metrics.
- ChartMogul: https://chartmogul.com/ – Specialized subscription analytics platform that provides insights into effective SaaS metric tracking and visualization.
- Segment: https://segment.com/ – Data integration platform that demonstrates effective approaches to connecting multiple data sources, a core capability for analytics platforms.
10. New Service Ideas
Idea 1: MetricsMentor
Overview
MetricsMentor transforms how businesses understand and act on their data by combining powerful analytics with an AI assistant that not only visualizes metrics but actively interprets them, explaining their significance in plain language and recommending specific actions. Unlike traditional dashboards that simply display data, MetricsMentor functions as a virtual data analyst and business advisor, continuously monitoring metrics across various business systems, identifying meaningful patterns, and proactively notifying users about significant trends, anomalies, and opportunities with contextual explanations and suggested next steps tailored to their specific business.
Who is the target customer?
▶ Small to medium-sized business owners and executives who lack in-house data analysis expertise
▶ Marketing teams struggling to connect metrics to strategic decisions
▶ E-commerce businesses needing to optimize across multiple platforms
▶ SaaS companies seeking to improve customer retention through data-driven strategies
What is the core value proposition?
Most businesses today collect vast amounts of data but struggle to translate it into meaningful action. They often face information overload from multiple dashboards that display metrics without clearly explaining their significance or how to respond. This creates a frustrating experience where companies know they should be using data to drive decisions but lack the expertise to interpret what the numbers actually mean for their business. MetricsMentor eliminates this gap between data and action by providing AI-powered analysis that explains metrics in business terms, identifies the most important trends to focus on, and recommends specific tactics based on proven strategies. Users receive the benefits of having a dedicated data analyst and business consultant without the associated costs or technical complexity.
How does the business model work?
• Freemium tier with limited connections and basic AI insights to drive initial adoption
• Core subscription ($49-99/month) with full AI capabilities across standard business platforms
• Premium tier ($199-299/month) with advanced predictive modeling and industry benchmarking
• Enterprise tier with custom integration support, dedicated account management, and advanced security
What makes this idea different?
Unlike traditional analytics dashboards that simply display data, MetricsMentor provides active interpretation and strategic guidance. While competitors focus on visualization tools for technical users, MetricsMentor emphasizes actionable business intelligence for non-technical decision makers. The AI system continuously improves its recommendations through machine learning based on outcomes from similar businesses, creating an increasingly valuable knowledge base that turns data patterns into proven tactical advice. The platform also distinguishes itself by prioritizing plain-language explanations of complex metrics, making sophisticated analytics accessible to users without statistical training.
How can the business be implemented?
- Develop core data connectors for major platforms (Google Analytics, Facebook Ads, Shopify, etc.)
- Create initial AI models for pattern recognition and anomaly detection
- Build natural language generation system for metric explanations
- Develop recommendation engine based on business type and metrics patterns
- Launch MVP to early adopters with focus on refining AI capabilities based on user feedback
What are the potential challenges?
• AI accuracy for business recommendations requires substantial training data and refinement
• Developing and maintaining numerous platform integrations demands significant engineering resources
• Educating users on the differences between passive dashboards and active AI advisors requires clear messaging and user onboarding
• Competing against well-established dashboard tools requires significant differentiation in both marketing and product capabilities
Idea 2: VerticalVision
Overview
VerticalVision reimagines business analytics by abandoning the one-size-fits-all approach in favor of deeply specialized, industry-specific platforms. Rather than creating generic dashboards that users must configure for their industry, VerticalVision launches separate, purpose-built analytics products for underserved verticals like dental practices, law firms, construction companies, and independent restaurants. Each vertical solution comes with pre-configured metrics that matter specifically to that industry, built-in benchmarking against similar businesses, industry-standard KPI targets, and workflows designed around how professionals in that field actually make decisions. This hyper-focused approach delivers immediate value without the setup complexity of general-purpose analytics tools.
Who is the target customer?
▶ Small to mid-sized dental and medical practices
▶ Independent law firms and legal practices
▶ Construction and contracting businesses
▶ Independent restaurants and hospitality businesses
What is the core value proposition?
Businesses in specialized industries struggle with generic analytics platforms that require extensive customization to track the specific metrics and KPIs relevant to their field. These professionals typically lack both the time and technical expertise to configure general-purpose analytics tools, resulting in poor adoption and limited data-driven decision making. Meanwhile, they face growing competitive pressure from larger chains and corporate entities that have sophisticated analytical capabilities. VerticalVision eliminates this disadvantage by providing pre-built, industry-specific analytics that work out of the box with the exact systems these businesses already use. The platform delivers immediate insights on the specific metrics that drive success in each vertical, enabling small independent businesses to make data-driven decisions with the same sophistication as their larger competitors, but without requiring technical expertise or significant time investment.
How does the business model work?
• Industry-specific subscription plans based on business size ($99-399/month)
• Tiered pricing within each vertical based on number of locations or practitioners
• Implementation and data migration services as optional add-ons
• Premium tier with advanced competitive benchmarking and AI-powered forecasting
What makes this idea different?
Unlike general analytics platforms that try to serve all industries with a single product, VerticalVision creates purpose-built solutions for specific verticals with unique metrics, terminology, and workflows. The platform differentiates through deep industry knowledge embedded in each vertical product, including industry-standard calculations, typical performance benchmarks, and decision frameworks used by successful businesses in that specific sector. This approach delivers superior relevance and faster time-to-value than generic analytics tools that require extensive configuration. The industry specialization also enables more accurate peer benchmarking and more relevant recommendations than general-purpose analytics platforms can provide.
How can the business be implemented?
- Select initial target vertical based on market research and competitive analysis
- Partner with industry experts to define key metrics and decision workflows
- Develop integrations with the specific software systems used in that vertical
- Build and test the first vertical-specific product with a small group of beta users
- Launch and establish market position in the first vertical before expanding to additional industries
What are the potential challenges?
• Each new vertical requires significant industry expertise and new integrations, limiting scaling speed
• Reaching specialized vertical markets requires different marketing approaches than general SaaS products
• Limited addressable market within each vertical necessitates efficient customer acquisition
• Maintaining product development across multiple vertical products requires careful resource allocation
Idea 3: CollabMetrics
Overview
CollabMetrics reinvents business analytics by transforming static dashboards into collaborative decision-making hubs where teams don’t just view data but actively work with it together. The platform combines comprehensive data visualization with built-in discussion, task assignment, decision tracking, and accountability features directly tied to specific metrics and KPIs. When metrics change or anomalies appear, CollabMetrics doesn’t just display the information—it facilitates the entire team response process from initial discussion to action planning, task assignment, execution tracking, and outcome measurement. This creates a closed-loop system where data directly drives collaborative action and teams can clearly see the impact of their decisions.
Who is the target customer?
▶ Marketing teams tracking campaign performance across channels
▶ Product teams monitoring usage metrics and customer feedback
▶ E-commerce businesses coordinating actions across marketing, inventory, and customer service
▶ SaaS companies managing retention, acquisition, and growth metrics across departments
What is the core value proposition?
Today’s businesses face a critical disconnect between their analytics dashboards and the actual decision-making processes they use to respond to data. Teams view metrics in one system but then switch to separate tools like Slack, email, and project management software to discuss findings, make decisions, and assign resulting tasks. This fragmentation leads to slow response times, inconsistent follow-through, and difficulty connecting actions back to metric outcomes. It also creates siloed knowledge where critical context about why certain decisions were made becomes lost over time. CollabMetrics solves this by embedding the entire collaborative decision process directly within the analytics interface, creating a single workspace where teams can seamlessly move from data insight to coordinated action while maintaining a permanent record of decisions and outcomes tied directly to specific metrics and time periods. This approach dramatically improves team alignment, accelerates response time to changing metrics, and creates institutional memory around data-driven decisions.
How does the business model work?
• Team-based subscription model starting at $29/user/month with minimum of 5 users
• Department tier ($49/user/month) with advanced workflow automation and approval processes
• Enterprise tier with cross-department coordination features, enhanced security, and custom integrations
• Add-on modules for specialized needs (executive reporting, board presentations, regulatory compliance)
What makes this idea different?
While standard analytics platforms treat dashboards as passive displays of information, CollabMetrics reimagines them as active workspaces where the entire team decision cycle happens. The platform’s unique integration of metrics, discussion, decision documentation, task management, and outcome tracking in a single interface eliminates the disconnection between seeing data and acting on it. Unlike normal dashboards that show what happened, CollabMetrics connects these insights to who’s doing what about it and captures the full context of decisions for future reference. This approach creates significantly higher engagement with metrics and ensures that data insights consistently translate into coordinated action.
How can the business be implemented?
- Develop core analytics dashboard functionality with standard data source integrations
- Create the collaborative layer including contextual discussions, decision tracking, and task assignment
- Build workflow templates for common business processes (campaign optimization, product issue response, etc.)
- Develop integration with popular project management and communication tools
- Launch MVP focused on specific team use cases with high collaborative requirements
What are the potential challenges?
• Requiring entire teams to adopt a new platform creates higher adoption barriers than individual-user tools
• Balancing comprehensive collaboration features with dashboard simplicity requires careful UX design
• Competing against both established analytics platforms and collaboration tools necessitates clear positioning
• Integration with existing workflow tools is essential but technically challenging to implement seamlessly
Disclaimer & Notice
- Information Validity: This report is based on publicly available information at the time of analysis. Please note that some information may become outdated or inaccurate over time due to changes in the service, market conditions, or business model.
- Data Sources & Analysis Scope: The content of this report is prepared solely from publicly accessible sources, including official websites, press releases, blogs, user reviews, and industry reports. No confidential or internal data from the company has been used. In some cases, general characteristics of the SaaS industry may have been applied to supplement missing information.
- No Investment or Business Solicitation: This report is not intended to solicit investment, business participation, or any commercial transaction. It is prepared exclusively for informational and educational purposes to help prospective entrepreneurs, early-stage founders, and startup practitioners understand the SaaS industry and business models.
- Accuracy & Completeness: While every effort has been made to ensure the accuracy and reliability of the information, there is no guarantee that all information is complete, correct, or up to date. The authors disclaim any liability for any direct or indirect loss arising from the use of this report.
- Third-Party Rights: All trademarks, service marks, logos, and brand names mentioned in this report belong to their respective owners. This report is intended solely for informational purposes and does not infringe upon any third-party rights.
- Restrictions on Redistribution: Unauthorized commercial use, reproduction, or redistribution of this report without prior written consent is prohibited. This report is intended for personal reference and educational purposes only.
- Subjectivity of Analysis: The analysis and evaluations presented in this report may include subjective interpretations based on the available information and commonly used SaaS business analysis frameworks. Readers should treat this report as a reference only and conduct their own additional research and professional consultation when making business or investment decisions.
[/swpm_protected]
No comment yet, add your voice below!