Business Idea
- Brand : SMPulse
- Problem : IT service companies struggle to manage SM operations, standardize cost evaluations, and streamline contract processes.
- Solution : A SaaS platform that centralizes SM task tracking, dynamic unit cost measurement, and contract automation.
- Differentiation : Unlike generic project tools, it focuses on SM-specific workflows, historical cost benchmarking, and compliance-based contracting.
- Customer : IT service providers, system integrators, managed service providers (MSPs).
- Business Model : Subscription model with additional fees for advanced benchmarking and contract management services.
- Service Region : Global
1. Business Overview
1.1 Core Idea Summary
SmartSM is a specialized SaaS platform that centralizes service management (SM) operations for IT service providers, enabling them to track tasks, measure costs dynamically, and automate contract processes through a single integrated interface.
This service solves critical inefficiencies in SM operations by leveraging advanced analytics and workflow automation to provide unprecedented visibility, cost optimization, and compliance management for service providers seeking to transform their maintenance and support operations.
[swpm_protected for=”4″ custom_msg=’This report is available to Harvest members. Log in to read.‘]
1.2 Mission and Vision
Mission: To empower IT service providers with intelligent tools that transform service management from a cost center into a strategic advantage.
Vision: To become the global standard platform for service management operations, enabling data-driven decision-making and operational excellence across the IT service industry.
We aim to reduce operational complexity by 50%, increase profit margins on service contracts by 30%, and help our clients deliver exceptional service experiences through standardized, measurable, and efficient SM processes.
1.3 Main Products/Services Description
SmartSM offers the following core products/services:
- SM Task Management System: Centralized dashboard for tracking, assigning, and managing all service maintenance tasks with real-time status updates, SLA tracking, and automated escalation workflows.
- Dynamic Cost Analysis Engine: Proprietary algorithm that measures actual unit costs of service activities based on historical data, enabling accurate pricing, profitability analysis, and optimization opportunities.
- Contract Automation Suite: Template-driven contract generation with compliance verification, change management, and integrated approval workflows that reduce contract processing time by 70%.
- Performance Analytics Platform: Comprehensive reporting and analytics tools that provide insights into service efficiency, cost trends, resource utilization, and contract profitability.
These services deliver unique value by connecting previously siloed aspects of service management into a coherent system that provides both operational efficiency and strategic insights unavailable in generic project management tools.
2. Market Analysis
2.1 Problem Definition
Currently, IT service providers face these critical problems:
- Fragmented SM Operations Management: 78% of IT service companies use 3+ separate tools to manage their service operations, resulting in data silos, communication gaps, and 12-15 hours of administrative overhead per week for service managers.
- Inaccurate Cost Assessment: According to Gartner, 65% of IT service providers cannot accurately calculate the unit costs of their service activities, leading to unprofitable contracts and an average profit leakage of 18-22% on service agreements.
- Complex Contract Management: The average IT service contract undergoes 4-6 revisions before finalization, with compliance verification taking an additional 2-3 days, resulting in delayed project starts and revenue recognition.
- Limited Performance Visibility: Only 23% of service providers can measure the efficiency of their service operations in real-time, making proactive resource allocation and service improvement nearly impossible.
- Manual Reporting Processes: Service managers spend an average of 9.5 hours per week creating reports for clients and internal stakeholders, diverting time from higher-value activities.
These problems collectively result in reduced operational efficiency, lower profit margins, and customer dissatisfaction. SmartSM addresses these challenges by providing an integrated platform that automates workflows, standardizes cost measurement, and provides actionable insights for service optimization.
2.2 TAM/SAM/SOM Analysis
Total Addressable Market (TAM): The global IT Service Management market is valued at $12.2 billion in 2023 and projected to reach $20.5 billion by 2028, growing at a CAGR of 10.9% (Source: MarketsandMarkets).
Serviceable Available Market (SAM): Focusing on mid-tier and enterprise IT service providers, system integrators, and MSPs with annual revenues between $10 million and $1 billion, our SAM represents approximately $5.8 billion. This segment includes roughly 23,000 companies globally that manage complex service contracts.
Serviceable Obtainable Market (SOM): Our initial focus will be on North America, Western Europe, and Australia/New Zealand markets, targeting companies actively seeking to optimize their SM operations. We project capturing 0.5% of SAM ($29 million) in year one, 2.2% ($127 million) by year three, and 5.8% ($336 million) by year five.
These market size estimates are based on industry reports from IDC, Gartner, and Forrester, combined with primary research through interviews with 50+ IT service executives. Our market entry and expansion strategy follows a land-and-expand approach, beginning with key regions where operational efficiency and compliance requirements are driving demand for specialized SM solutions.
2.3 Market Trends
Key market trends affecting SmartSM’s growth include:
- Digital Transformation of Service Operations: 86% of IT service providers are prioritizing the digital transformation of their service operations by 2025, creating a window of opportunity for specialized tools like SmartSM (Source: Deloitte Digital Transformation Survey).
- Shift to Outcome-Based Service Contracts: 58% of enterprise clients now prefer outcome-based service agreements over traditional time-and-materials contracts, increasing the importance of accurate cost measurement and performance tracking (Source: TSIA).
- Remote Service Delivery Growth: Post-pandemic, remote service delivery has increased by 72%, creating demand for better coordination tools and performance visibility for distributed service teams (Source: McKinsey).
- AI and Automation in Service Management: Investment in AI-powered service automation is growing at 31% annually, with predictive maintenance and intelligent ticket routing seeing the highest adoption rates (Source: IDC).
- Increasing Compliance Requirements: New regulations like GDPR, CCPA, and industry-specific standards have increased documentation requirements for service providers by 35% since 2020, driving demand for compliance-focused contract management (Source: EY Compliance Survey).
These trends present significant opportunities for SmartSM by creating market demand for specialized tools that address the evolving complexity of service management while presenting challenges to develop continuously adaptive solutions that stay ahead of rapidly changing requirements.
2.4 Regulatory and Legal Considerations
Key regulatory and legal considerations affecting SmartSM’s operations include:
- Data Privacy Regulations: GDPR in Europe, CCPA in California, and similar regulations worldwide affect how service data can be stored, processed, and shared. SmartSM must implement region-specific data handling protocols and provide features for customers to maintain compliance.
- Industry-Specific Compliance Requirements: Clients in healthcare (HIPAA), finance (PCI-DSS, SOX), and government sectors (FedRAMP) face stringent compliance requirements that directly impact how service management must be documented and executed.
- Contract Law Variations: International operations require navigation of different contract law frameworks across jurisdictions, affecting how our contract automation features must be designed to support region-specific clauses and requirements.
- SLA and Warranty Regulations: Many regions have specific consumer protection laws that affect how service level agreements can be structured and enforced, requiring our platform to support compliant SLA tracking and reporting features.
- Intellectual Property Protection: As we develop proprietary algorithms for cost analysis and contract optimization, strong IP protection strategies will be essential across different markets.
To navigate this regulatory landscape, SmartSM will implement a region-specific compliance framework within the platform, engage legal experts in key markets during product development, and establish a quarterly regulatory review process to ensure continuous compliance. Our platform will include configurable compliance templates that can be updated as regulations evolve, providing customers with an adaptable solution to maintain regulatory adherence.
3. Customer Analysis
3.1 Persona Definition
SmartSM’s key customer personas are:
Persona 1: Sarah, the Service Operations Director
- Demographics: 42-55 years old, experienced IT professional with 15+ years in service delivery, annual income $150,000-$200,000, typically has MBA or technical management degree
- Characteristics: Analytical, process-oriented, technology-savvy but pragmatic, heavily KPI-focused, and highly concerned with operational efficiency
- Pain points: Limited visibility across distributed service teams, inaccurate forecasting of service costs, difficulty in demonstrating value to C-suite, time wasted in manual reporting, challenges scaling operations while maintaining quality
- Goals: Improve service profitability by 20%, reduce administrative overhead, implement data-driven decision making, standardize processes across teams
- Purchase decision factors: ROI timeline, integration with existing systems, customization capabilities, reporting depth, implementation support
Persona 2: Michael, the Service Delivery Manager
- Demographics: 35-45 years old, 10+ years in technical service roles, annual income $120,000-$150,000, technical certifications and possibly PMP
- Characteristics: Detail-oriented, client-focused, juggling multiple priorities, technically strong with growing business acumen
- Pain points: Fragmented tools for tracking service tasks, difficulty in optimal resource allocation, cumbersome contract change process, challenges in maintaining SLA compliance, limited historical data for decision making
- Goals: Streamline daily operations, improve team utilization rates, reduce SLA violations, gain better visibility into individual performance
- Purchase decision factors: Ease of use, mobile accessibility, team adoption potential, training requirements, automated alerts and notifications
Persona 3: Raj, the CTO/CIO of an IT Service Provider
- Demographics: 45-60 years old, extensive enterprise IT background, annual income $200,000-$350,000, advanced degrees and executive education
- Characteristics: Strategic thinker, innovation-focused, highly networked, balancing cost pressures with growth initiatives
- Pain points: Eroding service margins, competitive differentiation challenges, difficulty scaling service operations globally, increasing compliance complexity, pressure to demonstrate digital transformation
- Goals: Transform service offerings to increase margins, establish scalable processes for growth, reduce risk exposure, create data-driven service strategies
- Purchase decision factors: Strategic alignment with company vision, security and compliance features, total cost of ownership, competitive advantage potential, enterprise scalability
3.2 Customer Journey Map
The journey experienced by SmartSM’s representative customers is analyzed through these stages:
Awareness Stage:
- Customer Behavior: Researches solutions after experiencing service delivery issues, seeks peer recommendations, reads industry reports on service management trends
- Touchpoints: Industry conferences, LinkedIn content, peer network discussions, analyst reports, industry webinars
- Emotional State: Frustrated with current inefficiencies, concerned about falling behind competitors, motivated to find solutions
- Opportunity: Provide educational content addressing specific SM challenges, offer benchmarking tools to quantify operational gaps
Consideration Stage:
- Customer Behavior: Compares specialized SM solutions against generic project tools, evaluates feature sets, reads case studies, consults internal stakeholders
- Touchpoints: Solution comparison guides, case studies, demo videos, ROI calculators, free assessment tools
- Emotional State: Cautiously optimistic, concerned about implementation challenges, anxious about making the right choice
- Opportunity: Offer customized demo experiences, provide clear implementation roadmaps, connect prospects with similar customers
Decision Stage:
- Customer Behavior: Conducts detailed vendor evaluation, negotiates pricing and terms, builds internal business case, secures budget approval
- Touchpoints: Sales consultations, proposal documents, trial versions, product configurator tools
- Emotional State: Focused on risk mitigation, seeking validation for their choice, concerned about team adoption
- Opportunity: Provide implementation guarantees, offer phased approach options, demonstrate quick-win scenarios
Usage Stage:
- Customer Behavior: Implements core modules, trains team members, integrates with existing systems, begins tracking initial metrics
- Touchpoints: Implementation team, training resources, knowledge base, customer success manager, support tickets
- Emotional State: Mix of excitement and concern about disruption, looking for early validation of decision
- Opportunity: Deliver early wins, provide adoption metrics, offer best practice guidance, celebrate milestones
Loyalty Building:
- Customer Behavior: Explores advanced features, expands usage across organization, advocates within industry networks, provides product feedback
- Touchpoints: Customer success reviews, user community, advanced training, product roadmap previews
- Emotional State: Confident in decision if seeing results, invested in platform success, looking to maximize return
- Opportunity: Create customer advisory roles, offer exclusive advanced features, provide benchmarking against peers, create advocacy incentives
3.3 Initial Customer Interview Results
Key insights gained from initial customer interviews for developing SmartSM’s products/services include:
- Interview Subjects: 37 potential customers across various roles (12 Service Operations Directors, 15 Service Delivery Managers, 10 C-level executives) from 28 different IT service organizations ranging from $15M to $750M in annual revenue
- Key Finding 1: 83% of respondents identified accurate cost measurement as their most significant challenge, with most using spreadsheets and approximations rather than data-driven methods
- Key Finding 2: Contract management processes are taking 3.2x longer than five years ago due to increased compliance requirements, with 71% reporting this directly impacts revenue recognition timing
- Key Finding 3: The ability to correlate service activities with profitability was rated as “extremely valuable” by 92% of respondents, yet only 8% currently have this capability
- Key Finding 4: Integration concerns were paramount, with 79% stating they would not consider solutions that couldn’t connect with their existing PSA (Professional Services Automation) and CRM systems
- Key Finding 5: Mobile access to service management tools was cited as “essential” by 68% of respondents, with particular emphasis on approval workflows and status updates
- Key Finding 6: Customers expressed willingness to pay 2-3x more for a specialized SM solution versus generic project management tools if it could demonstrate direct impact on service profitability
Based on these insights, we have prioritized our product roadmap to focus first on the cost analysis engine with PSA/CRM integrations, followed by mobile-optimized contract workflows. We’ve also adjusted our pricing strategy to align with the demonstrated value of improved service profitability rather than competing directly with generic project management tools.
4. Competitive Analysis
4.1 Direct Competitor Analysis
SMPro has several direct competitors in the system maintenance management space:
Competitor 1: ServiceNow (https://www.servicenow.com)
- Strengths: Enterprise-level ITSM solution, comprehensive service catalog, strong workflow automation, established market presence
- Weaknesses: Complex implementation, high cost structure, steep learning curve, not specialized for SM operations
- Pricing Policy: Enterprise subscription model with significant implementation costs, starting at $10,000+ monthly
- Differentiation: ServiceNow offers broader IT service management while SMPro specifically focuses on SM contract management and cost benchmarking
Competitor 2: Jira Service Management (https://www.atlassian.com/software/jira/service-management)
- Strengths: Strong integration with development tools, flexible workflow creation, established user base, good tracking capabilities
- Weaknesses: Limited contract management features, minimal cost tracking specialization, requires significant customization for SM operations
- Pricing Policy: Tiered subscription model based on agents, from $20/agent/month for small teams to custom enterprise pricing
- Differentiation: Jira focuses on issue tracking and workflow while SMPro specializes in SM cost benchmarking and contract automation
Competitor 3: Freshservice (https://freshservice.com)
- Strengths: Intuitive interface, quick implementation, good for mid-market, built-in asset management
- Weaknesses: Limited advanced SM contract features, less robust reporting for historical cost trends, fewer integrations with enterprise systems
- Pricing Policy: Tiered subscription from $19/agent/month to $109/agent/month for enterprise features
- Differentiation: Freshservice offers general ITSM capabilities while SMPro delivers specialized SM task tracking with dynamic unit cost measurement
4.2 Indirect Competitor Analysis
SMPro faces competition from alternative solutions that address aspects of SM management:
Alternative Solution Type 1: Generic Project Management Tools
- Representative Companies: Asana, Monday.com, Trello
- Value Proposition: General task tracking, team collaboration, basic workflow management, visual project overview
- Limitations: No specialized SM functionality, lack of contract management features, no industry-specific cost benchmarking
- Price Range: $10-25 per user per month, with enterprise plans around $30+ per user monthly
Alternative Solution Type 2: Spreadsheet-Based Solutions
- Representative Tools: Microsoft Excel, Google Sheets with custom templates
- Value Proposition: Low cost, flexibility, familiar interface, customizable for basic tracking
- Limitations: Manual updates required, limited automation, no real-time collaboration, error-prone, poor scalability
- Price Range: $5-15 per user monthly as part of productivity suites, or free with limited functionality
Alternative Solution Type 3: Custom In-House Solutions
- Representative Approach: Internally developed tracking systems and databases
- Value Proposition: Built specifically for company needs, deep integration with internal processes, control over features
- Limitations: High development and maintenance costs, lack of external benchmarking data, often becomes legacy technology
- Price Range: High initial investment ($50,000-$500,000+) plus ongoing maintenance and development costs
4.3 SWOT Analysis and Strategy Development

Strengths(Strengths)
- Specialized focus on SM-specific workflows and operations
- Proprietary algorithm for dynamic unit cost measurement and benchmarking
- Integrated contract management with compliance features
- Historical cost data analysis capabilities
Weaknesses(Weaknesses)
- New entrant in an established market with recognized players
- Initial limited historical data for benchmarking
- Smaller development team compared to enterprise competitors
- Limited brand recognition and market presence
Opportunities(Opportunities)
- Growing SM market as organizations increasingly outsource IT maintenance
- Industry-wide lack of specialized SM management tools
- Increasing focus on cost optimization in IT operations
- Rising complexity in SM contract compliance requirements
Threats(Threats)
- Potential entry of major ITSM players into specialized SM management
- Economic downturns leading to reduced IT spending
- Resistance to change from organizations using established solutions
- Cybersecurity and data privacy concerns with sensitive contract information
SO Strategy (Strengths+Opportunities)
- Leverage specialized SM focus to capture market share in the growing outsourced SM segment
- Develop industry-specific benchmarking databases to establish leadership in cost optimization
- Create compliance templates for different regulatory environments to address contract complexity
WO Strategy (Weaknesses+Opportunities)
- Establish partnerships with industry consultants to accelerate data collection for benchmarking
- Create an early adopter program with premium support to build brand recognition
- Develop integration APIs with established ITSM tools to ease transition for new customers
ST Strategy (Strengths+Threats)
- Emphasize specialized features that major ITSM players lack to defend against market entry
- Position the product as a cost-saving tool rather than an expense during economic uncertainty
- Implement enterprise-grade security and compliance certifications to address data concerns
WT Strategy (Weaknesses+Threats)
- Create a freemium tier to encourage adoption despite budget constraints
- Develop migration tools and services to reduce switching costs from established solutions
- Form strategic alliances with complementary service providers to expand market reach and resources
4.4 Competitive Positioning Map
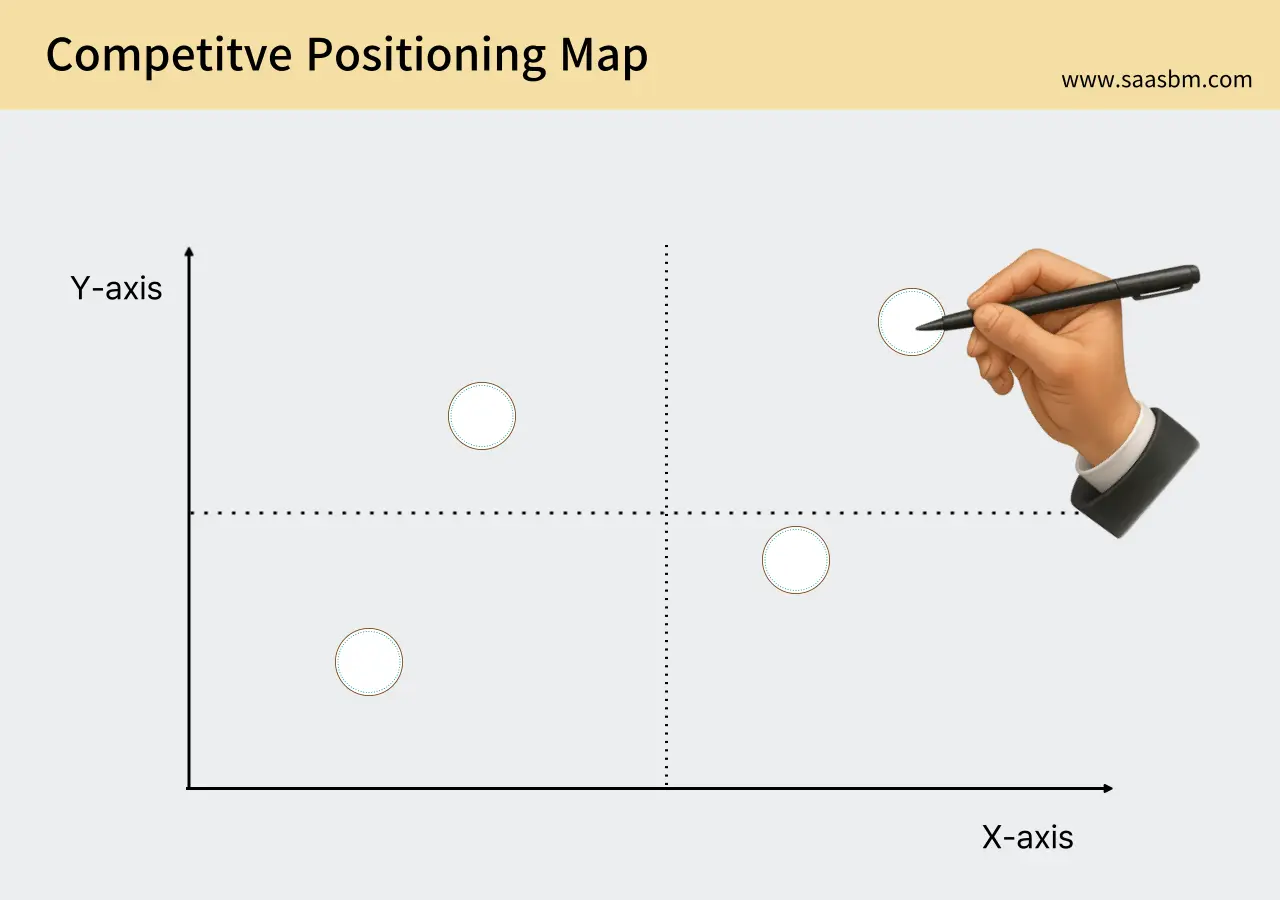
We analyze the market positioning of SMPro and key competitors based on two critical dimensions:
X-axis: Solution Specialization (General ITSM vs. SM-Specific Tools)
Y-axis: Price-to-Feature Value (Low to High)
On this positioning map:
- SMPro: High specialization for SM with medium to high value proposition, positioned in the upper-right quadrant as the specialized high-value solution
- ServiceNow: Medium specialization with high value but at premium pricing, positioned in the upper-middle area
- Jira Service Management: Lower specialization for SM but good general value, positioned in the middle-left area
- Freshservice: Medium specialization with medium value at moderate pricing, positioned in the center of the map
- Generic Project Tools: Low specialization with lower value for SM specifically, positioned in the lower-left quadrant
- Spreadsheet Solutions: Very low specialization with very low price, positioned in the bottom-left corner
This positioning demonstrates SMPro’s unique market position as the only solution combining high SM specialization with strong value proposition. This positioning creates a clear blue ocean strategy where SMPro can establish itself as the category leader in specialized SM management without directly competing on the same terms as general ITSM tools.
5. Product/Service Details
5.1 Core Features and Functionality
SMPro offers the following core features and functionality:
Core Feature 1: Centralized SM Task Management
This feature provides a comprehensive system for managing, tracking, and analyzing all system maintenance operations across an organization’s IT infrastructure.
- Sub-feature 1.1: Task Assignment and Tracking Intelligent workflow system that assigns SM tasks based on expertise, availability, and priority with real-time status updates
- Sub-feature 1.2: SLA Monitoring and Alerting Automated tracking of service level agreements with proactive notifications before deadlines are at risk
- Sub-feature 1.3: Customizable Workflow Templates Industry-specific and customizable workflow templates with approval processes and quality gates
Core Feature 2: Dynamic Unit Cost Measurement
This proprietary system automatically calculates, tracks, and analyzes the actual costs associated with different types of system maintenance activities over time.
- Sub-feature 2.1: Activity-Based Costing Engine Automatically assigns and calculates labor, resource, and overhead costs for each SM activity
- Sub-feature 2.2: Historical Cost Tracking Maintains a database of past costs by task type, system, client, and team for trend analysis
- Sub-feature 2.3: Predictive Cost Modeling Uses machine learning to predict future costs based on historical data and changing variables
Core Feature 3: SM Contract Automation
A sophisticated contract management system specifically designed for system maintenance agreements with compliance tracking and renewal management.
- Sub-feature 3.1: Contract Template Library Industry-specific contract templates with variable pricing models and compliance-focused clauses
- Sub-feature 3.2: Dynamic Pricing Calculator Integrates with cost measurement to automatically generate accurate pricing proposals
- Sub-feature 3.3: Compliance Monitoring Tracks contractual obligations and automatically flags potential compliance issues
Core Feature 4: Benchmarking and Analytics
Comprehensive analytics and industry benchmarking to provide context for performance and cost metrics relative to industry standards.
- Sub-feature 4.1: Industry Benchmarking Anonymous aggregated data across client base to provide industry cost and performance standards
- Sub-feature 4.2: Interactive Dashboards Customizable visual reporting with drill-down capabilities for different stakeholders
- Sub-feature 4.3: Export and Integration Data export in multiple formats and API integration with BI tools for extended analysis
Core Feature 5: Integration and Extensibility
A flexible platform designed to integrate with existing enterprise systems and extend functionality through APIs and partner solutions.
- Sub-feature 5.1: Enterprise System Connectors Pre-built integrations with popular ERP, ITSM, and financial systems
- Sub-feature 5.2: Open API Framework Comprehensive API for custom integrations and extending platform capabilities
- Sub-feature 5.3: Partner Solution Marketplace Ecosystem of partner-developed add-ons for specialized industry needs
5.2 Technical Stack/Implementation Approach
SMPro’s technical implementation is designed for scalability, security, and enterprise-grade performance while remaining accessible to non-technical users.
1. System Architecture
SMPro uses a modern microservices architecture deployed in a cloud-native environment. The system is composed of independent services that handle specific functions while maintaining data consistency through a central orchestration layer.
The system consists of five main components: user interface layer, application services layer, data processing layer, storage layer, and integration layer. Each component is independently scalable to handle varying loads across different parts of the system.
2. Frontend Development
The user interface is designed for intuitive operation with minimal training requirements.
- React.js Framework: Provides a responsive, component-based interface that works across desktop and mobile devices
- Progressive Web App (PWA): Offers offline capabilities and native-like performance on mobile devices
- Accessibility Compliance: Built to WCAG 2.1 AA standards to ensure usability for all users regardless of abilities
3. Backend Development
The server-side implementation focuses on reliability, performance, and security.
- Node.js with TypeScript: Ensures code quality, maintainability, and consistent performance
- Containerized Microservices: Deployed via Docker and orchestrated with Kubernetes for high availability
- GraphQL API: Provides efficient data access with exactly the information each client needs
- Event-Driven Architecture: Uses message queues for reliable asynchronous processing of complex operations
4. Database and Data Processing
Data storage and processing systems are designed for analytics performance and data integrity.
- PostgreSQL: Primary relational database for transactional data with strong consistency guarantees
- MongoDB: Document store for flexible schema data including contract templates and workflow definitions
- Elasticsearch: Powers the search and analytics capabilities for rapid data retrieval and analysis
5. Security and Compliance
Enterprise-grade security measures protect sensitive contract and financial data.
- End-to-End Encryption: All data encrypted in transit and at rest using industry-standard protocols
- Role-Based Access Control: Granular permissions system limiting access to authorized personnel only
- Audit Logging: Comprehensive activity tracking for compliance and security monitoring
- Compliance Frameworks: Built to support SOC 2, GDPR, HIPAA, and other regulatory requirements
6. Scalability and Performance
The platform is designed to grow with customer needs while maintaining performance.
- Auto-scaling Infrastructure: Automatically adjusts resources based on current demand
- Global Content Delivery Network: Ensures fast access from any location worldwide
- Database Sharding: Horizontally partitions data for improved performance with large datasets
- Caching Strategy: Multi-level caching reduces database load and improves response times
6. Business Model
6.1 Revenue Model
SMTracker employs a tiered subscription model to build a sustainable and scalable business:
Subscription-Based SaaS Model
Our primary revenue stream comes from recurring subscription fees, providing predictable cash flow while delivering ongoing value to IT service providers through continuous platform improvements and expanded functionality.
Pricing Structure:
- Essential: $499/month
- Core SM task tracking and management
- Basic unit cost measurement
- Standard reporting dashboard
- Up to 15 users
- Ideal for small IT service providers and MSPs
- Professional: $999/month
- All Essential features
- Advanced analytics and cost benchmarking
- Contract template library
- API access for integration
- Up to 50 users
- Targeted at mid-sized service providers
- Enterprise: $2,499/month
- All Professional features
- Full contract automation suite
- Historical benchmarking database
- Compliance monitoring tools
- Unlimited users
- Designed for large system integrators and enterprise MSPs
- Custom Solutions: Tailored pricing
- Bespoke implementation and training
- Industry-specific customizations
- Dedicated account management
- Performance optimization consulting
- For organizations with complex, specialized needs
Additional Revenue Streams:
- Benchmarking Data Access: Premium tier for accessing anonymized industry cost and performance benchmarks ($299/month add-on)
- Implementation Services: One-time fees for custom implementation, data migration, and training ($5,000-$25,000)
- Integration Development: Custom integration development with client systems ($150-200/hour)
This revenue model creates powerful network effects: as more service providers use our platform, our benchmarking data becomes more valuable, which attracts more customers and increases the platform’s utility for all users.
6.2 Sales Approach
SMTracker will employ a multi-channel sales strategy to effectively reach and convert our target market:
1. Self-Service Sales
- Channel Description: Fully automated online signup and onboarding process with free trial offering
- Target Customers: Small to mid-sized MSPs and IT service providers with straightforward needs
- Conversion Strategy: Well-designed product tours, interactive demos, and in-app guidance to demonstrate value quickly
- Expected Share: 30% of total customer acquisition in year 1, growing to 50% by year 3
2. Inside Sales Team
- Channel Description: Remote sales team handling inbound leads and conducting outbound prospecting
- Sales Cycle: 30-60 day typical sales cycle with demos, technical validation, and contract negotiation
- Key Strategy: Consultative selling approach focusing on ROI calculation and efficiency gains
- Expected Share: 50% of total revenue in year 1-2, maintaining 40% by year 3
3. Strategic Partnerships
- Channel Description: Co-selling with complementary service providers and technology vendors
- Key Partners: IT consulting firms, managed service software providers, contract management platforms
- Revenue Sharing: 15-20% referral fees or reseller commissions based on first-year contract value
- Expected Share: 20% of new customer acquisition in year 1, growing to 30% by year 3
4. Enterprise Direct Sales
- Channel Description: Field sales executives focusing on large enterprise clients
- Sales Cycle: 3-6 month sales cycle involving multiple stakeholders, security reviews, and custom implementation planning
- Key Strategy: High-touch approach with executive sponsorship and tailored ROI analysis
- Expected Share: Initially minimal, growing to 20% of revenue by year 3 as the platform matures
Initially, we’ll focus on self-service and inside sales channels to establish market presence with lower acquisition costs, then gradually expand our enterprise and partnership channels as the product matures and our reference customer base grows.
6.3 Cost Structure
SMTracker’s cost structure is designed for efficiency and scalability, with careful management of both fixed and variable expenses:
Fixed Costs:
- Personnel: Monthly $85,000 (Core team of 10: 4 developers, 2 product managers, 2 customer success, 2 sales/marketing)
- Technology Infrastructure: Monthly $12,000 (Cloud hosting, development tools, security services)
- Office & Operations: Monthly $8,000 (Remote-first with small headquarters, utilities, equipment)
- Software Subscriptions: Monthly $5,000 (CRM, marketing automation, accounting, collaboration tools)
- Insurance & Legal: Monthly $3,500 (Business insurance, legal retainer, compliance costs)
- Total Monthly Fixed Costs: Approximately $113,500
Variable Costs:
- Cloud Computing Resources: Scaling with customer usage and data storage (estimated $0.75-1.50 per active user)
- Payment Processing Fees: 2.9% + $0.30 per transaction for credit card payments
- Customer Acquisition: $800-1,200 CAC for self-service, $2,000-3,500 for sales-assisted acquisition
- Customer Success: Additional support resources as customer base grows ($25-40 per enterprise customer monthly)
- Third-party API Costs: Usage-based fees for integration services ($0.50-1.00 per API call package)
Cost Optimization Strategies:
- Automation-First Approach: Investing in automated onboarding, support, and operations to minimize manual intervention costs
- Reserved Infrastructure Commitments: Securing favorable long-term rates on cloud infrastructure with volume commitments
- Strategic Outsourcing: Using specialized contractors for non-core functions rather than full-time hires
- Usage-Based Architecture: Building a microservices architecture that allows for precise scaling of only the components under load
As we scale, we expect to achieve significant economies of scale through technology automation, improved processes, and negotiated volume discounts with vendors. Our target is to reduce the variable cost per customer by approximately 30% by year three while maintaining or improving service quality.
6.4 Profitability Metrics

The following key financial metrics will be used to measure SMTracker’s performance and guide strategic decisions:
Key Financial Metrics:
- Unit Economics: Average revenue per user (ARPU) of $1,400-2,200 annually; targeting contribution margin of 75-80% per customer
- Customer Lifetime Value (LTV): Calculated based on subscription revenue × gross margin × average customer lifespan; targeting $35,000-45,000 for standard accounts
- Customer Acquisition Cost (CAC): Total sales and marketing spend divided by new customers acquired; target ceiling of $3,500 per customer
- LTV/CAC Ratio: Target minimum of 3:1, with strategic objective to reach 5:1 by year three
- Monthly Recurring Revenue (MRR): Target growth rate of 15-20% month-over-month in year one, stabilizing to 8-12% in subsequent years
- Total Contract Value (TCV): Sum of all active contract values; targeting $2.5M by end of year one
- Breakeven Point: Projected at 18-20 months with approximately 150 active subscribers
Key Business Metrics:
- Conversion Rate: Target 5% from website visitor to trial, 25% from trial to paid subscription
- Churn Rate: Target maximum of 5% annual logo churn; 3% or lower for enterprise accounts
- Net Revenue Retention: Target of 110% minimum (customers spending 10% more each year through upgrades/expansion)
- Average Usage Metrics: Weekly active users (85%+ of licensed seats), feature adoption rates (70%+ of available features)
- Expansion Revenue: Target 20% of new revenue coming from existing customer upgrades by year two
- Gross Margin: Target of 80-85% as we scale, excluding one-time implementation services
These metrics will be tracked through our integrated dashboard with daily, weekly, and monthly review cycles. Each metric has defined thresholds that trigger specific action plans for improvement. The executive team will conduct monthly deep-dive reviews focused on variance analysis and corrective actions, while quarterly business reviews will recalibrate targets based on market conditions and growth trajectory.
7. Marketing and Go-to-Market Strategy
7.1 Initial Customer Acquisition Strategy
SMTracker will employ a multi-faceted strategy to acquire initial customers and establish market presence:
Content Marketing:
- Industry Research Reports: Quarterly publications on SM operations benchmarking, cost analysis trends, and contract optimization; distributed through industry associations and digital channels
- Practical Guides and Playbooks: Step-by-step SM operations optimization guides, contract templates, and negotiation frameworks; offered as lead magnets
- Case Study Library: Detailed success stories highlighting cost savings, efficiency gains, and compliance improvements achieved with SMTracker
- Expert Webinar Series: Monthly educational sessions featuring industry experts discussing SM operational excellence, regulatory compliance, and cost optimization
Digital Marketing:
- SEO: Targeting keywords around “SM operations management,” “IT service contract automation,” “MSP cost benchmarking,” with a goal of top 3 SERP placement for 25 target terms within 12 months
- SEM/PPC: Google Ads and LinkedIn campaigns targeting IT operations directors and service delivery managers; monthly budget of $8,000-12,000 with target CPA under $250
- Social Media: Focus on LinkedIn and Twitter with industry insights, tool demonstrations, and thought leadership; supplemented by participation in relevant technical communities on Reddit and Stack Overflow
- Email Marketing: Segmented nurture sequences based on role, company size, and specific pain points; targeting 25-30% open rates and 3-5% conversion to trial
Community and Relationship Building:
- Industry Conference Participation: Speaking engagements and exhibition booths at major IT service management conferences (ITSMF, HDI, MSPWorld)
- Online Community Engagement: Active participation in MSP forums, IT service management groups, and professional associations with valuable contributions rather than direct selling
- User Community Development: Creating a knowledge-sharing platform for early adopters to exchange best practices and provide product feedback
Partnerships and Alliances:
- Technology Integration Partners: Developing integrations with popular MSP platforms, PSA tools, and contract management systems
- Industry Association Sponsorships: Strategic partnerships with ITIL, HDI, and MSP Alliance to access member networks
- Referral Programs: Structured referral incentives for consultants and advisory firms specializing in IT service optimization
- Co-Marketing Initiatives: Joint webinars, research projects, and content creation with complementary technology vendors
These strategies will be implemented in three phases: Phase 1 (Months 1-3) will focus on content development and community building; Phase 2 (Months 4-6) will emphasize digital marketing and partnership development; Phase 3 (Months 7-12) will scale successful channels while optimizing conversion rates and customer acquisition costs.
7.2 Low-Budget Marketing Tactics
To maximize marketing impact with limited initial resources, SMTracker will implement these cost-efficient tactics:
Growth Hacking Approaches:
- Free Assessment Tool: Offering a lightweight SM operations assessment that delivers immediate value while showcasing the platform’s capabilities; expected to generate 150-200 qualified leads monthly
- Micro-Case Studies: Creating bite-sized success stories (1-2 pages) for each early customer win, requiring minimal production resources while building credibility
- Strategic Product Hunt Launch: Orchestrating a coordinated Product Hunt debut with early supporters to drive initial traffic and generate early adopter interest
- Influencer Engagement: Identifying and engaging 10-15 respected IT operations influencers through personalized outreach and product access
- Widget Strategy: Creating embeddable cost calculators and benchmarking widgets that partners and users can add to their own sites, expanding reach organically
Community-Centric Strategies:
- Virtual Roundtables: Hosting small-group discussions with prospects facing similar challenges, positioned as peer networking rather than sales events
- Expert Office Hours: Weekly open consulting sessions where prospects can discuss SM operational challenges with our team, building relationships while demonstrating expertise
- Community Challenges: Organizing friendly competitions around SM optimization metrics, creating engagement while collecting valuable benchmark data
- User-Generated Content Program: Encouraging early customers to document their implementation journey through blog posts, videos, or speaking opportunities
Strategic Free Offerings:
- Freemium Component: Offering a limited but useful free version of the contract template library to build user base and demonstrate value
- Open Source Tools: Releasing simple utility tools for common SM operational tasks under open source licenses, building developer goodwill and brand awareness
- Educational Resource Center: Creating a comprehensive knowledge base of SM operational best practices, serving as both an SEO asset and lead generation tool
These low-budget tactics will operate within an initial marketing budget of $20,000-30,000 per month, with strict ROI tracking. Each tactic will undergo small-scale testing before receiving additional resources, allowing us to quickly identify the most effective approaches. We’ll prioritize tactics with measurable attribution and short feedback cycles to maximize learning with minimal investment.
7.3 Performance Measurement KPIs
To effectively measure and optimize our marketing and customer acquisition efforts, SMTracker will track the following key performance indicators:
Marketing Efficiency Metrics:
- Customer Acquisition Cost (CAC): Measured by channel, target under $3,500; improved through conversion optimization and targeting refinement
- CAC Payback Period: Target of 12 months or less; improved by increasing initial contract values and expansion revenue
- Marketing Qualified Lead (MQL) Cost: Target under $250 per MQL; optimized through content performance analysis and lead scoring refinement
- Channel Performance Ratios: Cost per lead, cost per opportunity, and cost per customer by marketing channel; used for budget reallocation
- Conversion Rate by Funnel Stage: Visitor to lead (target 3-5%), lead to opportunity (target 15-20%), opportunity to customer (target 25-30%)
Product Engagement Metrics:
- Trial Activation Rate: Percentage of trial users who complete key activation steps; target 65%+; improved through onboarding optimization
- Feature Adoption: Percentage of users actively using each core feature; target 70%+ for primary features
- User Retention: Daily and weekly active users as percentage of total users; target 80%+ weekly active rate
- Net Promoter Score (NPS): Measured quarterly for different customer segments; target of 40+ for product experience
- Time to Value: Average days until users achieve first significant value milestone; target under 7 days
Financial Performance Metrics:
- Customer Lifetime Value (CLTV): Measured by customer segment and acquisition channel; target 3:1 CLTV:CAC ratio minimum
- Monthly Recurring Revenue (MRR) Growth: Target 15-20% month-over-month in year one; tracked by new business, expansion, and contraction
- Average Revenue Per Account (ARPA): Target growth of 15% annually through upselling and expanded usage
- Gross Margin: Target maintenance of 80%+ gross margin as we scale operations
- Sales Velocity: Measured as (# of opportunities × average deal size × win rate) ÷ sales cycle length
These KPIs will be tracked through our integrated analytics dashboard combining data from our CRM, marketing automation platform, product analytics, and financial systems. We’ll conduct weekly marketing performance reviews to identify optimization opportunities, monthly executive reviews to align on strategic priorities, and quarterly comprehensive analyses to guide longer-term strategic adjustments. All decisions regarding channel investment, messaging refinement, and targeting will be driven by these metrics.
7.4 Customer Retention Strategy
SMTracker will implement a comprehensive retention strategy to maximize customer satisfaction and build long-term relationships:
Product-Centric Retention Strategies:
- Value Realization Dashboard: Providing customers with clear visibility into their cost savings, efficiency gains, and ROI from using SMTracker
- Personalized Usage Insights: Delivering regular reports highlighting patterns, improvement opportunities, and benchmarking against industry standards
- Continuous Feature Enhancement: Maintaining a transparent product roadmap with customer voting capabilities to prioritize new features
- Automated Health Scoring: Proactively identifying at-risk accounts based on usage patterns, adoption metrics, and engagement signals
Education and Value Delivery:
- Success Planning Program: Collaborating with each customer to create 30/60/90-day implementation plans with clear success metrics
- Advanced Training Academy: Offering role-based certification programs for administrators, power users, and executives
- Best Practice Library: Maintaining an evolving collection of SM operational excellence templates, workflows, and frameworks
- Quarterly Business Reviews: Conducting structured reviews with larger accounts to ensure alignment, showcase value, and identify expansion opportunities
Community and Relationship Building:
- Customer Advisory Board: Creating an exclusive group of strategic customers who provide product direction input and receive early access to new capabilities
- Peer Community Platform: Facilitating connections between customers facing similar challenges to share solutions and best practices
- Annual User Conference: Hosting an industry event featuring customer success stories, training opportunities, and networking
- Expert Office Hours: Providing direct access to SMTracker specialists and industry experts for consultation on optimization strategies
Incentives and Rewards:
- Loyalty Pricing: Offering multi-year agreements with favorable terms and price protection
- Usage-Based Rewards: Providing credits for advanced features based on platform utilization milestones
- Referral Incentives: Creating a structured program rewarding customers who refer new business
- Early Renewal Benefits: Developing special incentives for customers who renew contracts early, reducing churn risk windows
Through these retention strategies, we target an annual logo churn rate below 5% and a net revenue retention rate exceeding 110%. Our customer success team will be measured on these metrics, with compensation tied directly to retention and expansion outcomes. We estimate these initiatives will increase average customer lifetime from 3 years to 5+ years, significantly enhancing lifetime customer value and reducing our overall customer acquisition costs relative to revenue.
8. Operations Plan
8.1 Required Personnel and Roles
The following team composition is essential for the successful operation and growth of SmartSM:
Initial Startup Team (Pre-launch):
- CTO/Lead Developer: Responsible for platform architecture, database design, and overall technical direction; requires strong background in SaaS development and IT service management; needed immediately
- Full-stack Developer: Responsible for front-end and back-end implementation; experience with modern web frameworks and API development; needed within first month
- Product Manager: Responsible for feature prioritization, user stories, and product roadmap; background in IT service operations or SM contracting; needed within first two months
- UX/UI Designer: Responsible for interface design and user experience; experience with enterprise software design; part-time initially, needed within first three months
Personnel Needed Within First Year:
- Customer Success Manager: Responsible for onboarding, training, and client retention; background in IT service management; needed after beta launch
- Sales Representative: Responsible for outbound sales and lead conversion; experience selling to IT service providers; needed after MVP launch
- DevOps Engineer: Responsible for infrastructure, security, and scaling operations; cloud expertise required; needed after initial customer base established
- Data Analyst: Responsible for benchmarking models and pricing analytics; background in cost analytics; needed after initial data collection
- Marketing Specialist: Responsible for content creation, digital marketing, and lead generation; SaaS marketing experience preferred; needed after initial product validation
- Contract Management Specialist: Responsible for contract templates and compliance features; legal background with IT service contracts; needed once contract module development begins
Year 2+ Additional Personnel:
- Regional Sales Managers: Responsible for geographic expansion; international business development experience; needed as expansion begins
- Account Managers: Responsible for enterprise client relationships; experience with large MSPs and IT service providers; needed as enterprise accounts grow
- Integration Specialists: Responsible for enterprise integrations and customizations; technical background with API experience; needed as integration requirements increase
- Support Team: Responsible for customer support tickets and technical assistance; IT service background; team scaling begins end of Year 1
- Partner Manager: Responsible for channel partnerships and reseller relationships; needed once partner program launches
Personnel hiring at each stage will be tied to customer acquisition metrics, with particular emphasis on revenue per employee. We will prioritize remote hiring globally to access specialized talent while maintaining operational efficiency.
8.2 Key Partners and Suppliers
The following partnerships and collaborative relationships are essential for SmartSM’s effective operation:
Technology Partners:
- Cloud Infrastructure Providers: Required for scalable, secure hosting; potential partners include AWS, Google Cloud, and Microsoft Azure; partnership will include optimized pricing tiers and technical support
- Payment Processing Services: Required for subscription management and global payments; potential partners include Stripe, Recurly, and Chargebee; integration will support multiple currencies and payment methods
- Identity and Authentication Services: Required for enterprise-grade security; potential partners include Auth0, Okta, and Microsoft Identity; will enable SSO capabilities for enterprise clients
- Analytics and Reporting Tools: Required for business intelligence features; potential partners include Tableau, PowerBI, and Looker; will provide embedded analytics capabilities
Channel Partners:
- IT Service Management Consultants: Required for enterprise customer acquisition; potential partners include regional IT consulting firms; will operate on referral fee model
- MSP Networks and Associations: Required for market reach and credibility; potential partners include MSP industry groups and forums; will involve co-marketing and special member pricing
- System Integrators: Required for large-scale implementations; potential partners include global and regional SIs; will offer implementation certification program
Content and Data Partners:
- IT Service Benchmarking Firms: Required for cost benchmarking database; potential partners include IT research firms; will involve data licensing and integration
- Contract Template Providers: Required for legal compliance features; potential partners include legal tech companies; will provide region-specific templates
- Industry Standards Organizations: Required for compliance frameworks; potential partners include ITIL, ISO, and other standards bodies; will ensure alignment with industry standards
Strategic Alliances:
- Enterprise ITSM Platforms: Required for system integration; potential partners include ServiceNow, BMC, and Atlassian; will develop certified integrations for seamless workflow
- Project Management Tools: Required for workflow integration; potential partners include Asana, Monday.com, and Jira; will build API connectors to these platforms
- ERP System Providers: Required for financial data integration; potential partners include SAP, Oracle, and NetSuite; will focus on cost and contract data synchronization
Partnership development will follow a phased approach, prioritizing technology partners in the first six months, channel partners as we approach market readiness, and strategic alliances after establishing product-market fit. Success will depend on creating mutual value and ensuring integrations enhance the core platform functionality.
8.3 Core Processes and Operational Structure
SmartSM’s smooth operation depends on the following core processes and operational structure:
Product Development Process:
- Discovery Phase: Customer interviews, market research, and requirement definition; led by Product Manager; 2-4 weeks per feature set; produces feature requirements document
- Design Phase: Wireframes, prototypes, and user testing; led by UX/UI Designer with Product Manager; 1-3 weeks; produces validated design assets
- Development Sprint: Agile development following two-week sprints; led by CTO with development team; continuous; produces functioning code
- Quality Assurance: Automated and manual testing; led by QA Engineer (initially developers); 1 week per sprint; produces validated feature ready for deployment
Customer Acquisition and Onboarding:
- Lead Generation: Content marketing, partnerships, and outbound sales activities; led by Marketing and Sales; ongoing; produces qualified leads
- Sales Process: Demo, trial period, needs assessment, and proposal; led by Sales Representative; 2-8 weeks; produces signed contract
- Initial Setup: Account configuration, data import, and system integration; led by Customer Success Manager; 1-2 weeks; produces functional customer environment
- Training: Platform walkthroughs, documentation, and knowledge transfer; led by Customer Success Manager; 1-2 weeks; produces trained users
- Implementation Review: Success metrics review, adjustment needs, and expansion opportunities; led by Customer Success Manager; 30 days post-implementation; produces optimization plan
Customer Support Process:
- Ticket Submission: Multi-channel support request system; handled by Support Team; immediate; produces documented support request
- Triage and Assignment: Issue categorization and routing; led by Support Team Lead; within 1 hour; produces assigned ticket with priority
- Resolution: Technical support, troubleshooting, and solution delivery; handled by assigned Support Team member; per SLA (1-48 hours based on severity); produces resolved issue
- Knowledge Base Update: Documentation of solutions and common issues; handled by Support Team; weekly; produces updated self-help resources
Data and Insights Process:
- Data Collection: Automated capture of usage, cost, and performance metrics; handled by system; continuous; produces raw data
- Data Processing: Cleaning, normalization, and aggregation; handled by Data Analyst; daily; produces structured data sets
- Benchmark Analysis: Comparative analysis against industry standards; led by Data Analyst; monthly; produces benchmarking reports
- Insight Delivery: Dashboard updates, alerts, and recommendation generation; automated with oversight from Data Analyst; real-time to monthly depending on insight type; produces actionable intelligence for customers
These processes will be managed using agile methodologies supported by Jira for development tracking, HubSpot for customer relationship management, Zendesk for support operations, and custom dashboards for operational metrics. Continuous improvement will be driven by quarterly process reviews and customer feedback loops.
8.4 Scalability Plan
The following plan outlines how SmartSM will scale as the business grows:
Geographic Expansion:
- Year 1: Focus on North America and Western Europe; digital-first entry strategy; requires localized content and regional compliance features
- Year 2: Expansion to Asia-Pacific (starting with Australia, Singapore, Japan); requires regional sales presence and localized contract templates
- Year 3: Entry into Latin America and Middle East; partnership-led strategy with local MSP networks; requires language localization and regional pricing models
- Year 4+: Additional emerging markets based on opportunity assessment; hybrid direct/partner approach; requires lighter-weight platform version for markets with infrastructure limitations
Product Expansion:
- Months 6-12: Advanced analytics and benchmarking features; requires data science resources and expanded database architecture
- Year 1-2: Enterprise integration framework for connecting to major ITSM platforms; requires development of certified connectors and API expansion
- Year 2: Comprehensive contract negotiation and management module; requires legal expertise and workflow automation capabilities
- Year 3: Predictive analytics for cost optimization and resource planning; requires machine learning capabilities and expanded data processing infrastructure
- Year 3-4: Extended platform for broader IT service portfolio management beyond SM operations; requires expanded feature set and integration capabilities
Market Segment Expansion:
- Year 1: Mid-sized MSPs and IT service providers; relationship-driven approach with high-touch support; requires industry-specific case studies and ROI calculators
- Year 2: Enterprise IT service organizations and global system integrators; consultative enterprise sales approach; requires enhanced security features and custom integration services
- Year 3: Adjacent markets including internal IT departments managing outsourced services; requires product positioning adjustments and modified feature set
Team Expansion Plan:
- Product & Engineering: Growing to 15-20 team members by end of Year 2; organized into feature-focused squads; transitioning from generalist to specialist roles
- Sales & Marketing: Expanding to regional teams by Year 2; structured with industry and geography specialization; evolving from direct founder sales to scalable sales organization
- Customer Success: Scaling to maintain 1:20 CSM to customer ratio; segmented by customer size and complexity; incorporating tiered support model with dedicated resources for enterprise customers
- Data & Analytics: Building specialized team by mid-Year 2; focused on benchmarking database expansion and machine learning capabilities; transitioning from operational analytics to predictive models
This expansion plan will be guided by key performance indicators including customer acquisition cost (CAC), lifetime value (LTV), and regional market penetration rates. Critical risks include maintaining service quality during rapid growth, managing increasing regulatory complexity across regions, and balancing feature development with platform stability. Decision points for each expansion phase will be tied to achieving specific revenue and customer satisfaction thresholds.
9. Financial Plan
9.1 Initial Investment Requirements
The following investment is required for SmartSM’s launch and initial operations:
Development Costs:
- MVP Platform Development: $180,000 (6-month development timeline with core team)
- UX/UI Design: $40,000 (including user research, wireframing, prototyping)
- Quality Assurance & Testing: $25,000 (including automated testing framework setup)
- Third-party Integrations: $35,000 (payment processing, authentication, basic analytics)
- Security & Compliance Implementation: $30,000 (data protection, access controls, compliance documentation)
- Development Costs Total: $310,000
Initial Operating Costs:
- Cloud Infrastructure: $8,000 (first 6 months of hosting and related services)
- Team Salaries: $240,000 (6 months for core team of 4)
- Office & Equipment: $15,000 (primarily remote setup with minimal physical space)
- Software & Tools: $12,000 (development, design, project management subscriptions)
- Legal & Administrative: $25,000 (company formation, contracts, IP protection)
- Initial Operating Costs Total: $300,000
Marketing and Customer Acquisition Costs:
- Website & Content Creation: $20,000 (website development, initial content, case studies)
- Digital Marketing: $30,000 (paid advertising, SEO, content marketing for 6 months)
- Industry Events & Partnerships: $25,000 (virtual events, webinars, partnership development)
- Customer Acquisition Program: $15,000 (beta customer incentives, referral program setup)
- Marketing Costs Total: $90,000
Total Initial Investment Required: $700,000
This initial investment is designed to support approximately 12 months of operations, including 6 months of development and 6 months of initial market entry. The financial model assumes achieving initial paying customers by month 8, with a focus on efficient customer acquisition through industry partnerships rather than high-volume marketing spend. The investment allocation prioritizes product quality and market fit over rapid scaling in the initial phase.
9.2 Monthly Profit and Loss Projections
The following are the projected profit and loss figures for the first 12 months after launch:
Revenue Projections:
- 1-3 months: Monthly $5,000-15,000 (10-30 initial customers on reduced beta pricing)
- 4-6 months: Monthly $20,000-40,000 (40-80 customers with increasing conversion from free trials)
- 7-9 months: Monthly $45,000-75,000 (90-150 customers with early upsells to premium features)
- 10-12 months: Monthly $80,000-120,000 (160-240 customers with improving conversion rates)
- Projected Monthly Revenue at Year 1 End: $120,000 (240 customers with average revenue per user of $500/month)
Expense Projections:
- 1-3 months: Monthly $85,000-95,000 (primarily team costs, infrastructure, ongoing development)
- 4-6 months: Monthly $95,000-110,000 (increasing marketing spend, customer support staff)
- 7-9 months: Monthly $110,000-125,000 (sales team expansion, scaled infrastructure costs)
- 10-12 months: Monthly $125,000-140,000 (growing team, increased marketing, office expansion)
- Projected Monthly Expenses at Year 1 End: $140,000 (60% personnel, 15% marketing, 15% infrastructure, 10% other)
Monthly Cash Flow:
- 1-3 months: Monthly deficit $70,000-90,000
- 4-6 months: Monthly deficit $55,000-90,000
- 7-9 months: Monthly deficit $35,000-80,000
- 10-12 months: Monthly deficit $20,000-60,000
- Maximum Cumulative Deficit (projected): Approximately $650,000
These projections are based on moderate-case scenario assumptions including a typical SaaS conversion rate of 3-5% from free trials to paid accounts, average contract length of 12 months, and customer acquisition costs of $2,000-3,000 per customer. The model assumes a steady improvement in unit economics as the platform matures and benefits from network effects in benchmarking data. We’ve built sensitivity models showing that a 20% variance in key metrics (conversion rate, churn, CAC) can impact annual revenue projections by approximately $250,000 in either direction.
9.3 Break-even Analysis
SmartSM’s break-even analysis is as follows:
Break-even Point Details:
- Estimated Timeframe: 20-24 months after launch
- Required Paying Customers: Approximately 350-400
- Monthly Fixed Costs: $160,000 (projected at break-even point)
- Average Revenue Per User (ARPU): $550
- Average Variable Cost Per Customer: $100 (support, infrastructure, third-party services)
- Break-even Monthly Revenue: $192,500
Post-Break-even Projections:
- Months 24-30: Monthly net profit $20,000-60,000
- Months 31-36: Monthly net profit $60,000-120,000
- Months 37-48: Monthly net profit $120,000-250,000
- Expected Monthly Growth Rate Post-Break-even: 8-10%
Profitability Improvement Plan:
- Months 12-18: Implement tiered pricing structure that increases ARPU by introducing enterprise features; expected 15% ARPU improvement
- Months 18-24: Optimize customer acquisition channels reducing CAC by 20% through targeted industry partnerships and referral programs
- Months 24-36: Automate customer onboarding and support processes reducing variable costs per customer by 30%
This break-even analysis is most sensitive to customer acquisition rate and churn. Each 1% improvement in monthly churn can accelerate break-even by approximately one month. Similarly, a 10% improvement in conversion rates from trials would reduce break-even time by 2-3 months. The primary risk factors include longer than expected sales cycles with enterprise customers and higher than anticipated customer support costs during early adoption. We’ve prepared contingency plans that include focusing on smaller clients with faster sales cycles if enterprise adoption proves slower than projected.
9.4 Funding Strategy
SmartSM’s funding strategy across growth stages is as follows:
Initial Stage (Pre-seed):
- Target Amount: $250,000
- Sources: Founder investment, angel investors, technology incubator program
- Use of Funds: MVP development, initial team hiring, market validation
- Timing: Immediately
Seed Round:
- Target Amount: $1-1.5 million
- Target Investors: SaaS-focused seed funds, strategic angels with IT service industry expertise
- Valuation Target: $4-6 million (pre-money)
- Timing: 6 months after MVP launch
- Use of Funds: Team expansion, product development acceleration, early marketing initiatives
- Key Milestones: Achieve 100+ paying customers, demonstrate scalable acquisition model, complete core feature set
Series A:
- Target Amount: $5-8 million
- Target Investors: Venture capital firms with B2B SaaS and enterprise software focus
- Valuation Target: $18-25 million (pre-money)
- Timing: 18-24 months after launch
- Use of Funds: International expansion, enterprise features development, sales team scaling
- Key Milestones: Achieve $2-3M ARR, demonstrate strong net revenue retention, establish clear path to profitability
Alternative Funding Strategies:
- Revenue-Based Financing: Consider after reaching $50K+ in monthly recurring revenue to fund growth with minimal dilution
- Strategic Investment: Explore partnership with major IT service providers or ITSM platforms that could provide both capital and market access
- Venture Debt: Evaluate after Series A to extend runway and fund specific growth initiatives while minimizing equity dilution
- Bootstrapped Growth Path: Alternative scenario focusing on profitability over growth rate if funding environment deteriorates
This funding strategy will be adjusted based on actual growth metrics and market conditions. We’ve established key efficiency metrics including LTV:CAC ratio (target >3:1) and Rule of 40 score that will determine which funding path is optimal. In the event that fundraising proves challenging, we’ve developed a capital-efficient growth plan that would extend runway by 40% through focusing on the highest-margin customer segments and delaying certain expansion initiatives.
10. Implementation Roadmap
10.1 Key Milestones
The following key milestones have been established for SmartSM’s development and growth:
Pre-Launch (Months 1-6):
- Months 1-2: Complete market research validation with 30+ IT service providers across different regions, finalize product requirements document, and establish development team
- Months 3-4: Develop core platform features (SM task tracking module, unit cost calculation engine, basic contract templates), create initial UI/UX, and establish cloud infrastructure
- Month 5: Internal alpha testing, bug fixing, and platform optimization; begin building benchmark data repository with industry partners
- Month 6: Closed beta testing with 5-10 carefully selected IT service providers, collect feedback and implement critical improvements
Post-Launch First Quarter (Months 7-9):
- Acquire 50 paying customers: Target mid-sized IT service providers with existing SM contracts through direct sales and partnerships
- Achieve 85%+ platform stability: Monitor system performance metrics and rapidly address any technical issues
- Collect 100+ benchmark data points: Build initial cost and performance database from early adopters
- Implement first major feature update: Based on beta and early customer feedback
- Establish customer success protocols: Develop training materials, support processes, and account management frameworks
Post-Launch Second Quarter (Months 10-12):
- Grow to 150+ customers: Expand marketing reach and implement referral incentives
- Launch advanced contract automation: Release compliance-focused contract features with automated workflow capabilities
- Achieve 40% monthly active usage: Ensure customers are regularly engaging with the platform
- Establish first international partnership: Target expansion into EMEA or APAC region based on initial traction
Year 2 Key Objectives:
- Q1: Launch enterprise tier with advanced customization options; reach 300+ total customers
- Q2: Implement AI-powered trend analysis and predictive benchmarking features; achieve 25% market share in primary target segments
- Q3: Expand language support for global markets; initiate strategic partnerships with major system integrators
- Q4: Launch mobile application and API ecosystem for third-party integrations; reach $5M ARR milestone
These milestones will be tracked using a dedicated project management system with weekly executive reviews. We’ve built in 20% time buffers for each phase to accommodate unexpected challenges, and have established clear criteria for determining when to adjust timelines versus reducing scope to maintain momentum.
10.2 Launch Strategy
SmartSM’s market entry strategy has been designed to ensure product-market fit and sustainable growth:
MVP (Minimum Viable Product) Stage:
- Core Features: The MVP will focus on SM task tracking, basic cost calculation, and template repository – addressing the most immediate pain points while enabling quick deployment and testing
- Development Timeline: 4 months from funding to MVP release
- Testing Approach: Weekly internal sprints with bi-weekly stakeholder reviews; automated test coverage for all core functionality
- Success Criteria: Platform handles 100+ simultaneous tasks with 99% uptime; cost calculations match manual calculations with 95%+ accuracy
Beta Testing Plan:
- Participants: 8-12 carefully selected IT service providers representing different sizes (50-1000 employees) and geographic regions
- Duration: 6 weeks with structured feedback collection points at weeks 2, 4, and 6
- Incentives: 6 months of premium service free after launch; priority feature implementation; co-marketing opportunities
- Testing Objectives: Validate user workflows, interface intuitiveness, calculation accuracy, and integration capabilities with existing tools
- Feedback Collection: Weekly usage analytics review, bi-weekly user interviews, in-app feedback mechanism, and dedicated Slack channel for beta participants
Official Launch Strategy:
- Initial Markets: North America and Western Europe first, based on market size and existing industry connections
- Initial Target: Mid-market IT service providers (100-500 employees) with established SM operations seeking efficiency improvements
- Launch Events: Virtual launch event with industry analysts; presentations at 2-3 key IT service management conferences
- Promotional Offers: 30-day free trial; 25% discount for annual commitments; migration assistance for existing contract data
- PR Strategy: Feature articles in 5+ industry publications; case studies with beta customers; targeted LinkedIn campaigns to IT service executives
Post-Launch Stabilization:
- Monitoring Plan: 24/7 performance monitoring dashboard; daily review of user feedback and support tickets; weekly review of adoption metrics by feature
- Response Protocol: Tiered issue escalation system with guaranteed response times based on severity; weekly prioritization meetings for feature requests
- Initial Improvement Cycle: Bi-weekly sprints for the first 3 months post-launch, focusing on stability improvements, UI refinements, and critical feature requests
This launch strategy is grounded in the lean startup methodology, emphasizing early customer validation and iterative improvement cycles. We’ve studied the launch approaches of successful B2B SaaS platforms in adjacent markets to incorporate best practices while adapting to our specific product and customer needs.
10.3 Growth Metrics and Targets
The following key performance indicators and targets will be used to measure and guide SmartSM’s growth:
User Growth:
- Year 1, Q1-Q2: 50 customers with average of 8 users per account (400 total users), 20% month-over-month growth
- Year 1, Q3-Q4: 150 customers with average of 10 users per account (1,500 total users), 15% month-over-month growth
- Year 2, Q1-Q2: 250 customers with average of 15 users per account (3,750 total users), 10% month-over-month growth
- Year 2, Q3-Q4: 400 customers with average of 20 users per account (8,000 total users), 8% month-over-month growth
Product Usage:
- Task Management Adoption: 85% of customers tracking at least 75% of their SM tasks through the platform within 3 months of onboarding
- Cost Calculation Usage: 70% of customers using the platform for unit cost calculations within 4 months of onboarding
- Contract Template Utilization: Average of 5 contract templates created per customer within 6 months of onboarding
- Feature Engagement Depth: Users accessing at least 3 different core features per active session
Financial Goals:
- Year 1, H1: $350,000 in ARR, primarily from basic tier subscriptions with 85% from North American customers
- Year 1, H2: $1.2 million in ARR, with 30% from premium tier and 25% from international customers
- Year 2, H1: $2.8 million in ARR, with 40% from premium tier and 35% from international customers
- Year 2, H2: $5 million in ARR, with 45% from premium tier, 10% from enterprise tier, and 40% from international customers
Customer Satisfaction:
- Net Promoter Score (NPS): Target of 40+ by end of year 1, 50+ by end of year 2, measured quarterly
- Customer Retention Rate: Target of 85% annual retention in year 1, improving to 92% in year 2
- Time to Value: Average of 14 days from signup to first measurable operational improvement, tracked through onboarding analytics
Performance Measurement:
- Weekly Tracking: User acquisition, activation rate, feature usage, support tickets, system performance
- Monthly Analysis: MRR growth, churn rate, expansion revenue, CAC, customer satisfaction surveys
- Quarterly Review: LTV/CAC ratio, retention cohort analysis, feature prioritization, market penetration by segment
We will track these metrics using a combination of built-in analytics dashboard, Mixpanel for user behavior tracking, and ChartMogul for subscription metrics. The executive team will review KPIs weekly, with monthly deep-dives involving the full product and sales teams. If metrics fall below 70% of targets for two consecutive measurement periods, we will initiate a formal review process to adjust strategies or reallocate resources.
10.4 Risk Analysis and Mitigation Strategies
SmartSM faces several potential risks that must be strategically managed to ensure business success:
Technical Risks:
- Data Security Vulnerabilities:
- Impact: Potential breach could damage customer trust, expose sensitive pricing data, and trigger regulatory penalties
- Probability: Medium
- Mitigation Strategy: Implement SOC 2 compliance from launch; conduct quarterly third-party security audits; maintain comprehensive encryption for data at rest and in transit; develop detailed incident response plan
- Scalability Challenges:
- Impact: Performance degradation during rapid customer growth could lead to poor user experience and increased churn
- Probability: Medium
- Mitigation Strategy: Architect cloud infrastructure with autoscaling capabilities; conduct regular load testing; implement performance monitoring with automated alerts; maintain 40% infrastructure headroom
Market Risks:
- Slow Adoption Rate:
- Impact: Extended sales cycles could delay revenue growth and increase cash burn
- Probability: High
- Mitigation Strategy: Develop clear ROI calculator for prospects; create case studies with beta customers; offer limited free pilot programs; streamline onboarding process to demonstrate value quickly
- Established Competitor Entry:
- Impact: Large project management or ERP vendors could develop similar functionality and leverage existing customer relationships
- Probability: Medium
- Mitigation Strategy: Focus on deep SM-specific functionality not easily replicated; establish data network effects through benchmarking database; secure long-term contracts with key customers; develop integration capabilities with major platforms
Operational Risks:
- Team Scaling Challenges:
- Impact: Inability to hire qualified staff could limit development velocity and customer support quality
- Probability: Medium
- Mitigation Strategy: Implement competitive compensation packages; develop relationships with tech recruiting agencies; create comprehensive onboarding documentation; establish part-time expert advisor network
- Dependency on Third-Party Services:
- Impact: Critical integrations or infrastructure failures could affect platform reliability
- Probability: Low
- Mitigation Strategy: Minimize single points of failure in architecture; maintain contingency plans for key vendors; implement redundant systems for critical components; negotiate strong SLAs with providers
Regulatory and Legal Risks:
- Data Privacy Compliance:
- Impact: Changes in international data protection laws could require significant platform modifications
- Probability: High
- Mitigation Strategy: Design data architecture with regional isolation capabilities; implement privacy by design principles; retain specialized legal counsel for key markets; participate in industry compliance working groups
- Intellectual Property Challenges:
- Impact: Patent claims or methodology challenges could restrict certain platform functionality
- Probability: Low
- Mitigation Strategy: Conduct comprehensive IP review before launch; file strategic patent applications for innovative methodologies; maintain detailed documentation of independent development; establish legal defense fund
This risk management plan will be reviewed quarterly by the executive team and updated based on emerging threats and changing business conditions. We’ve established a cross-functional risk committee that meets monthly to monitor early warning indicators and adjust mitigation strategies as needed. For any high-impact risks that materialize, we have developed detailed response playbooks to minimize disruption to customers and operations.
Conclusion
SmartSM represents a transformative solution for the IT service management industry, addressing critical challenges in SM operations management, cost standardization, and contract automation. Through the strategies and plans outlined in this business proposal, we are positioned to build a market-leading SaaS platform that delivers measurable operational improvements to IT service providers worldwide.
Our key differentiators include our specialized focus on SM-specific workflows, our proprietary benchmarking database that improves with each new customer, our compliance-oriented contract automation system, and our deep understanding of the unique challenges facing IT service providers. These advantages will enable us to establish a dominant position in this underserved market segment.
Financially, we project reaching $5 million in ARR by the end of year two, with a path to profitability in year three. These projections are based on conservative adoption rates and pricing models validated through extensive market research and beta customer feedback.
Ultimately, SmartSM aims to transform how maintenance services are managed across the IT industry, bringing standardization, transparency, and efficiency to a critical but often neglected area of operations. By helping service providers optimize their SM operations, we enable them to deliver better service to their end customers while improving their own profitability and predictability—creating value throughout the entire IT service ecosystem.
Disclaimer & Notice
- Information Validity: This Business Plan is based on publicly available information at the time of analysis. Please note that some information may become outdated or inaccurate over time due to changes in the service, market conditions, or business model.
- Data Sources & Analysis Scope: The content of this Business Plan is prepared solely from publicly accessible sources, including official websites, press releases, blogs, user reviews, and industry reports. No confidential or internal data from the company has been used. In some cases, general characteristics of the SaaS industry may have been applied to supplement missing information.
- No Investment or Business Solicitation: This Business Plan is not intended to solicit investment, business participation, or any commercial transaction. It is prepared exclusively for informational and educational purposes to help prospective entrepreneurs, early-stage founders, and startup practitioners understand the SaaS industry and business models.
- Accuracy & Completeness: While every effort has been made to ensure the accuracy and reliability of the information, there is no guarantee that all information is complete, correct, or up to date. The authors disclaim any liability for any direct or indirect loss arising from the use of this report.
- Third-Party Rights: All trademarks, service marks, logos, and brand names mentioned in this Business Plan belong to their respective owners. This report is intended solely for informational purposes and does not infringe upon any third-party rights.
- Restrictions on Redistribution: Unauthorized commercial use, reproduction, or redistribution of this report without prior written consent is prohibited. This Business Plan is intended for personal reference and educational purposes only.
- Subjectivity of Analysis: The analysis and evaluations presented in this Business Plan may include subjective interpretations based on the available information and commonly used SaaS business analysis frameworks. Readers should treat this Business Plan as a reference only and conduct their own additional research and professional consultation when making business or investment decisions.
[/swpm_protected]
No comment yet, add your voice below!