Business Idea
- Brand : DealSpotter
- Problem : Real estate listing platforms are overwhelmed with properties, making it difficult for buyers to quickly identify listings priced significantly below market value—so-called urgent sales or distressed deals.
- Solution : This service scrapes data from real estate platforms daily at a fixed time, analyzes price trends, detects newly listed properties, and identifies those with sudden price drops or spikes. It then delivers timely information on these deals to users.
- Differentiation : Traditional real estate platforms primarily connect buyers and sellers. In contrast, this service specifically connects sellers offering urgent sales with buyers looking to purchase properties below market value, creating a niche marketplace for high-potential deals.
- Customer : Buyers seeking to generate immediate profit by acquiring underpriced properties, and real estate agencies targeting such buyers as clients.
- Business Model : B2B SaaS or subscription-based model
- Service Region : United States

1. Business Overview
1.1 Core Idea Summary
DealScout is an intelligent real estate analytics platform that identifies properties priced significantly below market value and delivers these opportunities to investors seeking immediate profit potential. By scraping and analyzing real estate listing data daily, the service detects newly listed properties and those with sudden price drops, providing time-sensitive alerts to subscribers.
This service solves the critical challenge faced by real estate investors who struggle to quickly identify undervalued properties among thousands of listings, giving them a competitive edge in a market where timing is crucial for capitalizing on distressed sales and urgent seller situations.
1.2 Mission and Vision
Mission: To democratize access to profitable real estate investment opportunities by providing timely, data-driven insights on undervalued properties.
Vision: To become the industry standard platform that transforms how real estate investment opportunities are discovered, creating a more efficient marketplace where qualified buyers can quickly locate and acquire undervalued properties.
We aim to empower real estate investors with technological tools that were previously available only to large institutions, helping individual investors build wealth through strategic property acquisition while reducing market inefficiencies.
1.3 Key Products/Services Description
DealScout offers the following core products and services:
- Daily Deal Alerts: Time-sensitive notifications about newly listed properties and sudden price drops that indicate potential below-market deals, delivered via email, SMS, or mobile app notifications.
- Market Value Analysis: Proprietary algorithms that analyze comparable properties to identify listings priced significantly below market value, with percentage estimates of potential equity.
- Deal Scoring System: A quantitative scoring model that ranks properties based on multiple factors including price-to-value ratio, neighborhood appreciation trends, and urgency indicators.
- Custom Deal Filters: Personalized search parameters allowing users to focus on specific property types, locations, price ranges, and potential ROI metrics.
- Market Analytics Dashboard: Visual reports showing historical pricing trends, market volatility, and opportunity density by neighborhood.
These services provide a significant competitive advantage by combining data automation with sophisticated analytics to identify time-sensitive opportunities before they’re recognized by the broader market.
2. Market Analysis
2.1 Problem Definition
Real estate investors and buyers currently face several critical challenges:
- Information Overload: The average U.S. metropolitan area has 15,000-30,000 active property listings at any given time, making manual discovery of undervalued properties virtually impossible. Studies show investors typically review less than 5% of available listings.
- Delayed Discovery: By the time undervalued properties are widely recognized, they’re often already under contract. According to National Association of Realtors data, properties priced 10% or more below market value typically receive offers within 48 hours of listing.
- Analytical Complexity: Accurately determining a property’s market value requires analyzing dozens of comparable sales and market trends – a time-consuming process that most buyers can’t perform quickly enough to capitalize on fleeting opportunities.
- Inefficient Communication: 68% of distressed property sellers fail to effectively market their situation, resulting in prolonged selling periods despite their willingness to accept below-market offers.
These problems lead to missed investment opportunities and market inefficiencies that DealScout directly addresses by automating discovery and analysis of undervalued listings.
2.2 TAM/SAM/SOM Analysis
Total Addressable Market (TAM): The U.S. real estate investment market includes approximately 7.5 million residential property transactions annually, valued at $2.3 trillion (National Association of Realtors, 2023). Additionally, there are 11.4 million individual real estate investors in the U.S. who make at least one investment purchase annually.
Serviceable Addressable Market (SAM): Focusing on the segment of investors specifically targeting undervalued properties, including fix-and-flip investors, wholesale buyers, and opportunity-focused real estate agencies, we estimate a SAM of 2.1 million potential users generating approximately $630 million in annual subscription revenue potential.
Serviceable Obtainable Market (SOM): Through targeted marketing to professional real estate investors and agencies in major U.S. metropolitan areas, we project capturing 0.8% of SAM in year one (16,800 subscribers), 3.2% by year three (67,200 subscribers), and 8% by year five (168,000 subscribers).
These market size estimates are based on data from the National Association of Realtors, Attom Data Solutions’ house flipping reports, and market surveys of active real estate investors, providing a realistic foundation for our market penetration strategy.
2.3 Market Trends
Key market trends influencing DealScout’s growth potential include:
- Increased Interest in Alternative Investments: With stock market volatility and inflation concerns, 36% of U.S. investors plan to increase real estate investment allocation in the next 24 months (Gallup Investor Survey, 2023).
- Data-Driven Investment Decision Making: 72% of professional real estate investors now rely on data analytics to inform purchase decisions, up from 48% five years ago (Real Estate Investment Analytics Report, 2023).
- Rising Institutional Investment in Single-Family Homes: Large investment firms have increased their market share in residential real estate by 57% since 2020, creating more competition for individual investors and increasing demand for tools that level the playing field.
- Distressed Property Opportunities: Mortgage delinquency rates are projected to increase 15-20% over the next 24 months due to economic pressures, creating more potential distressed sales opportunities (Mortgage Bankers Association forecast).
- Mobile-First Investment Tools: 83% of real estate investors under 45 expect to conduct property research primarily on mobile devices, emphasizing the need for accessible, on-the-go solutions.
These trends create a favorable environment for DealScout’s solution by increasing both the supply of undervalued properties and the demand for efficient discovery tools among increasingly data-oriented investors.
2.4 Regulatory and Legal Considerations
Key regulatory and legal considerations affecting DealScout’s operations include:
- Multiple Listing Service (MLS) Data Access Regulations: Access to and redistribution of MLS data is governed by agreements with local real estate associations. We’ll need to establish data licensing partnerships with key MLSs or work with authorized MLS data partners.
- Fair Housing Laws: All property recommendations and analytics must comply with the Fair Housing Act, avoiding any appearance of steering or discriminatory practices based on protected classes.
- Data Privacy Regulations: Compliance with CCPA (California) and other state privacy laws regarding user data collection, storage, and sharing will be essential as we collect user preference and behavior data.
- Terms of Use Compliance: Our data scraping activities must comply with the terms of service of source websites. We’ll need to establish proper API access where available and manage scraping activities within legal boundaries.
- Real Estate Licensing Requirements: While providing information tools doesn’t typically require real estate licenses, we must be careful not to provide services that could be construed as brokerage activities without appropriate licensing.
To address these regulatory challenges, we’ll implement a robust compliance program including regular legal reviews, data source relationship management, and clear user agreements defining the informational nature of our services.
3. Customer Analysis
3.1 Persona Definition
DealScout’s primary customer personas include:
Persona 1: Professional Property Flipper Frank
- Demographics: 35-50 years old, male, full-time real estate investor, $150,000+ annual income, bachelor’s degree or higher
- Characteristics: Tech-savvy, analytical decision-maker, time-conscious, operates with 3-5 active projects simultaneously
- Pain Points: Spends 15+ hours weekly searching for deals, faces intense competition from other investors, struggles to accurately assess property values quickly, misses opportunities due to delayed notifications
- Goals: Increase deal flow by 30%, reduce time spent on property searches, improve ROI on each project by finding better-priced properties
- Purchase Decision Factors: ROI potential, time savings, accuracy of valuations, ease of filtering out non-viable properties
Persona 2: Real Estate Agency Owner Rachel
- Demographics: 40-55 years old, female, owns mid-sized real estate brokerage, $200,000+ annual income, MBA or real estate education
- Characteristics: Relationship-focused, growth-oriented, manages team of 5-20 agents, values operational efficiency
- Pain Points: Struggles to provide unique value to investor clients, can’t effectively source exclusive deals for buyers, loses clients to competitors who find better properties
- Goals: Increase client retention, provide value-added services to investors, differentiate agency from competitors, boost commission revenue through higher transaction volume
- Purchase Decision Factors: Team accessibility, white-label capabilities, integration with existing CRM systems, client satisfaction metrics
Persona 3: Part-Time Investor Paul
- Demographics: 28-45 years old, male/female, employed full-time in another field, $90,000-$140,000 income, college educated
- Characteristics: Analytical, risk-aware, time-constrained due to primary career, building long-term wealth
- Pain Points: Limited time to search for properties, lacks professional network for off-market deals, insufficient experience to quickly evaluate potential deals, fears missing opportunities due to day job commitments
- Goals: Acquire 1-2 investment properties annually, build passive income stream, minimize research time while maximizing property quality
- Purchase Decision Factors: Ease of use, mobile accessibility, educational content, affordability, time efficiency
3.2 Customer Journey Map
Analysis of a typical customer journey through DealScout’s service:
Awareness Stage:
- Customer Actions: Experiences frustration with traditional property searches, researches solutions online, hears about DealScout through industry forums or social media
- Touchpoints: Google search, real estate investment podcasts, Facebook investor groups, YouTube tutorials, industry blogs
- Emotional State: Frustrated with current methods, skeptical of new solutions, hopeful about potential time savings
- Opportunities: Educational content addressing pain points, testimonials from successful users, free webinars on deal finding strategies
Consideration Stage:
- Customer Actions: Visits DealScout website, reviews feature list, compares pricing with alternatives, signs up for free trial
- Touchpoints: Website, email nurture sequence, demo videos, pricing page, chat support
- Emotional State: Cautiously optimistic, concerned about ROI, curious about platform capabilities
- Opportunities: Interactive calculators showing potential time/money saved, case studies of successful deals found, transparent feature comparison with alternatives
Decision Stage:
- Customer Actions: Tests platform during free trial, evaluates quality of identified deals, consults with peers, decides on subscription plan
- Touchpoints: Trial experience, onboarding emails, payment processing, plan selection page
- Emotional State: Evaluative, seeking validation that the tool works as promised, concerned about commitment
- Opportunities: Early-access deals during trial, concierge onboarding for higher-tier plans, money-back guarantee, discounted annual commitment options
Usage Stage:
- Customer Actions: Configures alert preferences, reviews daily deal notifications, clicks through to property details, pursues promising opportunities
- Touchpoints: Daily email alerts, mobile app notifications, dashboard analytics, property detail pages
- Emotional State: Initially excited, then judging platform based on deal quality, frustrated if not finding valuable opportunities
- Opportunities: Success tracking of viewed/pursued properties, personalized alert refinement suggestions, proactive customer success check-ins
Loyalty Building:
- Customer Actions: Shares successful deals found through platform, refers colleagues, upgrades subscription tier, provides feedback
- Touchpoints: Success stories submission form, referral program, account management calls, feature request portal
- Emotional State: Appreciative if finding good deals, evangelical if making significant profits, concerned about increasing competition
- Opportunities: Exclusive premium deals for long-term subscribers, community recognition for success stories, advanced feature access for loyal users
3.3 Initial Customer Interview Results
Key insights gained from initial customer interviews conducted to develop DealScout:
- Interview Sample: 32 potential customers including 18 full-time investors, 7 real estate agency owners, and 7 part-time investors across 12 different U.S. metropolitan areas
- Key Finding 1: 87% of interviewees reported spending more than 10 hours weekly searching for potential deals, with 62% stating they believe they miss valuable opportunities despite their efforts
- Key Finding 2: Price sensitivity varies significantly by segment – agency owners expressed willingness to pay $250-400/month for team access, while part-time investors were price-sensitive above $75/month
- Key Finding 3: Deal quality is the absolute priority, with interviewees unanimously agreeing they would pay more for a service that consistently delivers genuinely undervalued properties versus one that provides more numerous but marginal opportunities
- Key Finding 4: Mobile access is critical – 72% of respondents check property listings multiple times daily and expect real-time notifications when high-potential deals emerge
- Key Finding 5: Integration with existing workflows emerged as a consistent theme, with requests for export features to common CRMs and compatibility with standard analysis spreadsheets
- Key Finding 6: Privacy concerns were significant – investors worry about competitors knowing which properties they’re viewing and expressed desire for anonymous browsing features
Based on these insights, we’ve prioritized deal quality algorithms, mobile-first notification systems, flexible export options, and privacy controls in our initial product development. We’ve also structured tiered pricing to accommodate the significant variance in willingness to pay across customer segments.
4. Competitive Analysis
4.1 Direct Competitor Analysis
Analysis of DealScout’s direct competitors:
Competitor 1: PropStream (https://www.propstream.com)
- Strengths: Comprehensive property data including off-market properties, established brand with large customer base, extensive filtering capabilities, mobile app availability
- Weaknesses: High subscription cost ($99-$199/month), complex interface with steep learning curve, limited automated alerting capabilities, requires significant user input to identify deals
- Pricing: Basic plan at $99/month, team plans scaling up to $199/month per user
- Differentiation: PropStream focuses on comprehensive property data but lacks DealScout’s automated deal identification and time-sensitive alerting system
Competitor 2: DealMachine (https://www.dealmachine.com)
- Strengths: Excellent mobile app, driving-for-dollars functionality, direct mail marketing tools, strong user community
- Weaknesses: Primarily focused on direct mail marketing rather than automated deal finding, limited data analytics capabilities, requires significant manual effort
- Pricing: Tiered pricing from $49-$199/month based on features and usage limits
- Differentiation: DealMachine focuses on driving-for-dollars and marketing to distressed properties, while DealScout emphasizes automated online deal discovery
Competitor 3: Redfin (https://www.redfin.com)
- Strengths: Massive user base, robust property search functionality, free access to basic features, established brand reputation
- Weaknesses: General-purpose platform not specialized for investors, limited analytics for value assessment, basic notification system not optimized for time-sensitive deals
- Pricing: Basic service free, premium features through Redfin agent relationships
- Differentiation: Redfin serves the general homebuyer market while DealScout specifically targets investment opportunities with specialized analytics
Competitor 4: HouseCanary (https://www.housecanary.com)
- Strengths: Sophisticated AI valuation models, extensive market data, professional interface, strong institutional client base
- Weaknesses: Enterprise focus with high pricing, limited tools for individual investors, complex interface requiring significant expertise
- Pricing: Enterprise pricing model, typically $500+/month for individual access
- Differentiation: HouseCanary focuses on valuation accuracy and institutional clients while DealScout prioritizes deal discovery for individual investors and small agencies
4.2 Indirect Competitor Analysis
DealScout faces competition from the following alternative solutions:
Alternative Solution Type 1: Traditional Real Estate Platforms
- Representative Companies: Zillow, Realtor.com, Trulia
- Value Provided: Comprehensive property listings, basic search functionality, market trends data, connection to real estate agents
- Limitations: No specialized tools for identifying undervalued properties, limited analytical capabilities, no urgent sale identification features
- Price Range: Free for basic access, premium features typically $20-50/month
Alternative Solution Type 2: Manual Deal Analysis Services
- Representative Companies: Local real estate investment clubs, coaching programs, turnkey investment providers
- Value Provided: Curated deal recommendations, personal relationship, customized advice, sometimes exclusive access to off-market deals
- Limitations: High cost, limited deal volume, geographic restrictions, dependent on individual expertise
- Price Range: Typically $500-2,000/month for coaching services or percentage-based finder’s fees
Alternative Solution Type 3: DIY Market Analysis
- Representative Approach: Self-created systems using spreadsheets, manual MLS monitoring, and personal networking
- Value Provided: No direct cost, complete control over criteria, potential for discovering deals through relationship building
- Limitations: Extremely time-intensive, limited scalability, inconsistent results, high opportunity cost
- Price Range: No direct cost but significant time investment (15-20 hours/week for serious investors)
Alternative Solution Type 4: Wholesaler Networks
- Representative Companies: Regional wholesaling operations, investor networks, Facebook investor groups
- Value Provided: Pre-screened deals, negotiation already completed, simplified transaction process
- Limitations: Wholesaler fee reduces profit margin, competition from other buyers on same deals, limited volume in many markets
- Price Range: No subscription cost but typically 5-15% markup on properties
4.3 SWOT Analysis and Strategy Development

Strengths
- Proprietary algorithm for detecting undervalued properties and urgent sales
- Automated daily data collection providing near real-time deal identification
- Focused solution addressing a specific, high-value investor need
- Capital-efficient business model with predictable SaaS revenue streams
- Scalable technology infrastructure capable of covering all major U.S. markets
Weaknesses
- Dependency on third-party data sources and potential scraping limitations
- New market entrant with limited brand recognition compared to established platforms
- Initial geographic coverage limitations during early growth phase
- Potential for algorithm false positives/negatives affecting user satisfaction
- Reliance on continued availability of distressed/undervalued property inventory
Opportunities
- Growing investor market due to increased interest in real estate as an alternative investment
- Anticipated increase in distressed properties due to economic conditions
- Potential for premium partnerships with real estate agencies and investor groups
- Expansion into complementary services like property valuation and portfolio management
- International expansion opportunities in similar real estate markets (Canada, UK, Australia)
Threats
- Potential legal challenges from real estate listing platforms regarding data access
- Established competitors expanding into the undervalued property niche
- Market conditions reducing the availability of distressed properties
- Regulatory changes affecting real estate data accessibility
- Low barriers to entry allowing new competitors to emerge
SO Strategies (Strengths+Opportunities)
- Leverage automated algorithms to rapidly scale coverage to capitalize on growing investor interest across multiple markets
- Develop white-label solution for real estate agencies seeking to offer premium services to investor clients
- Create tiered service offerings targeting both casual and professional investors with different pricing and feature sets
WO Strategies (Weaknesses+Opportunities)
- Establish API partnerships with data providers to reduce dependency on web scraping and improve data reliability
- Implement aggressive early-adopter pricing to build user base and brand recognition
- Create user feedback mechanisms to continuously improve algorithm accuracy based on actual investment outcomes
ST Strategies (Strengths+Threats)
- Diversify data sources to ensure resilience against potential access restrictions from any single platform
- Develop proprietary valuation metrics that provide unique value beyond basic listing data
- Build community features that increase switching costs and user loyalty
WT Strategies (Weaknesses+Threats)
- Focus initial launch on markets with highest distressed property density to establish proof of concept
- Implement rigorous compliance program to ensure all data usage respects legal boundaries
- Develop content marketing strategy positioning DealScout as thought leader to build brand without massive marketing budget
4.4 Competitive Positioning Map
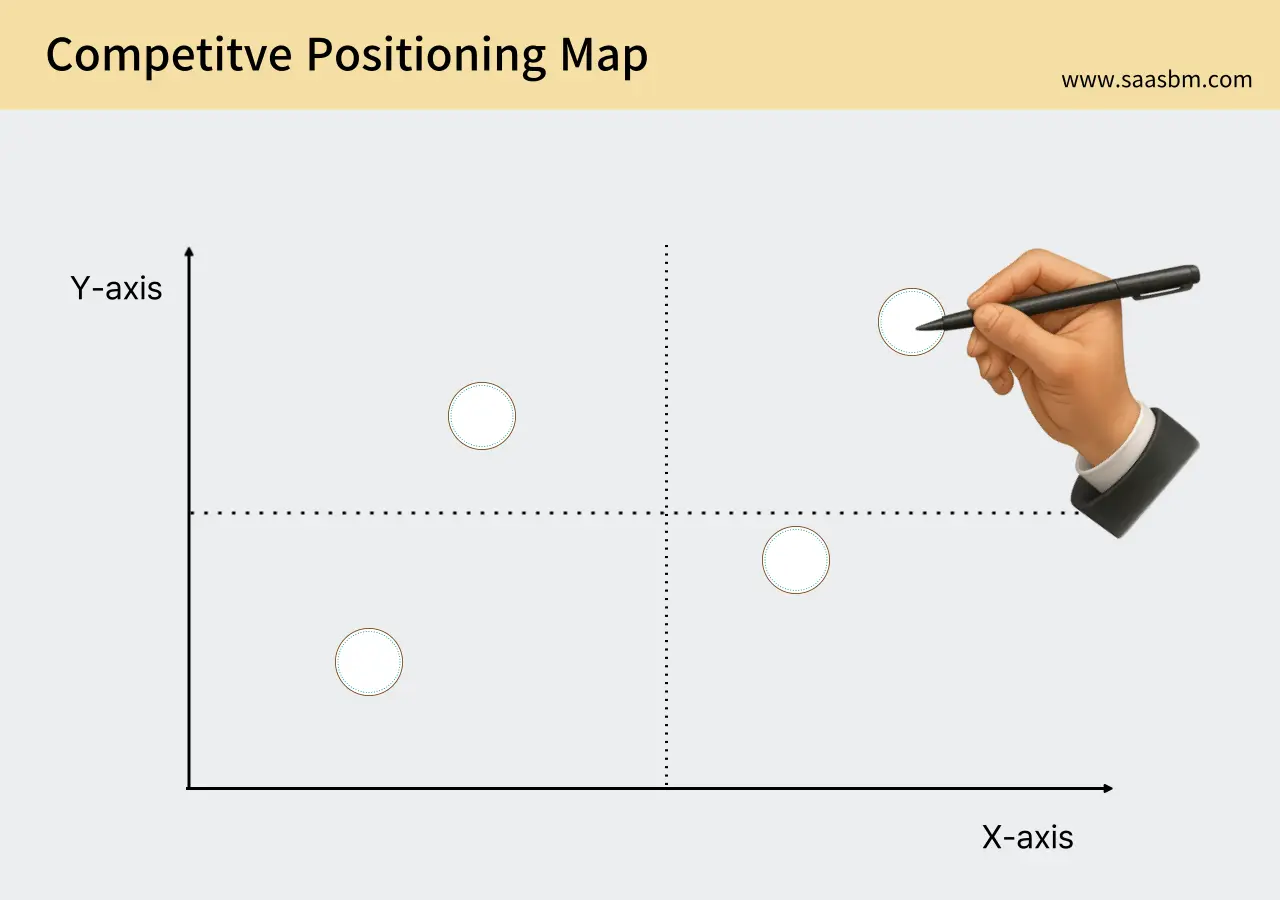
Analyzing the market positioning of DealScout and key competitors based on two critical axes:
X-axis: Deal Discovery Automation (Manual to Fully Automated)
Y-axis: Investor Specialization (General Real Estate to Investor-Specific Features)
On this positioning map:
- DealScout: Positioned in the upper-right quadrant (high automation, high investor specialization), offering the most automated approach to investor-specific deal finding
- PropStream: Positioned in the upper-center (moderate automation, high investor specialization), offering strong investor tools but requiring more manual analysis
- DealMachine: Positioned in the middle-right area (high automation for specific functions, moderate investor specialization), with strong automation for driving-for-dollars but less focus on MLS-listed opportunities
- Redfin/Zillow: Positioned in the lower-left quadrant (low automation for investors, low investor specialization), serving general real estate needs with minimal investor-specific features
- HouseCanary: Positioned in the middle-upper area (moderate automation, high investor specialization), with strong valuation tools but less focus on deal discovery
- Manual Methods: Positioned in the bottom-left (low automation, varying investor specialization), representing traditional approaches to deal finding
This positioning map reveals DealScout’s unique market position as the most automated, investor-focused solution for discovering undervalued properties. This positioning creates a clear value proposition for time-conscious investors seeking efficiency in their deal discovery process, distinguishing us from both general real estate platforms and more manual investor tools.
5. Product/Service Details
5.1 Core Features and Characteristics
RealDeal Finder offers the following core features and characteristics:
Core Feature 1: Automated Property Data Collection
Our proprietary scraping system collects real-time data from major real estate platforms across the United States at scheduled intervals. This ensures users have access to the most recent property listings and price changes without manual searching.
- Sub-feature 1.1: Multi-platform integration with major real estate websites including Zillow, Realtor.com, Redfin, and local MLS systems
- Sub-feature 1.2: Scheduled data collection at optimal times (early morning and evening) when new listings typically appear
- Sub-feature 1.3: Legal compliance mechanisms to respect website terms of service and maintain ethical data collection practices
Core Feature 2: Price Anomaly Detection
Our advanced algorithm identifies properties priced significantly below market value through comparative analysis with similar properties in the same area, automatically flagging potential deals based on price-to-value ratios.
- Sub-feature 2.1: Machine learning models that analyze property characteristics, location data, and historical pricing
- Sub-feature 2.2: Customizable anomaly thresholds based on user preferences (10-30% below market value)
- Sub-feature 2.3: Pattern recognition for identifying desperate seller signals in listing descriptions
Core Feature 3: Instant Alert System
Users receive immediate notifications when properties matching their criteria and pricing thresholds are identified, allowing them to act quickly on time-sensitive opportunities before other buyers.
- Sub-feature 3.1: Multi-channel notifications (email, SMS, mobile push notifications)
- Sub-feature 3.2: Prioritized alerts based on deal quality score and user preferences
- Sub-feature 3.3: One-click access to detailed property information from alerts
Core Feature 4: Deal Analytics Dashboard
A comprehensive dashboard that displays potential investment metrics and property analysis, helping users quickly evaluate the quality of each opportunity with minimal research effort.
- Sub-feature 4.1: Estimated ROI calculator based on local rental rates and property management costs
- Sub-feature 4.2: Neighborhood trend analysis showing property value growth projections
- Sub-feature 4.3: Comparable property analysis with side-by-side metrics
Core Feature 5: Professional Agent Connection
Users can instantly connect with partner real estate agents who can quickly schedule viewings and submit offers on their behalf, drastically reducing the time between opportunity identification and action.
- Sub-feature 5.1: Network of pre-vetted, responsive agents specializing in fast transactions
- Sub-feature 5.2: Built-in scheduling system for immediate property viewings
- Sub-feature 5.3: One-click offer submission templates based on user-defined parameters
5.2 Technical Stack/Implementation Method
RealDeal Finder’s technical implementation is designed to be robust, scalable, and efficient while remaining compliant with regulations and ethical standards.
1. System Architecture
The system consists of three primary components: the data collection engine, the analysis and detection core, and the user-facing application layer. Each component is designed to work independently to ensure stability and optimize performance.
The architecture follows a microservices approach, allowing us to scale individual components as needed and minimize downtime during updates or maintenance.
2. Frontend Development
The user interface is built to be intuitive and responsive across all devices.
- React.js: Provides a fast, responsive interface that updates in real-time as new deals become available
- Progressive Web App (PWA): Enables mobile-friendly access without requiring separate native apps
- Material-UI: Ensures consistent, professional design language across all interfaces
3. Backend Development
Our backend systems are optimized for data processing speed and reliability.
- Node.js: Powers our main application server, offering excellent performance for our real-time alert system
- Python: Handles data processing, analysis, and machine learning components
- AWS Lambda: Manages scheduled scraping tasks with cost-effective serverless architecture
- Docker: Containerizes services for consistent deployment across development and production environments
4. Database and Data Processing
Our data infrastructure is designed to handle large volumes of real estate information efficiently.
- MongoDB: Stores flexible property data schemas that can adapt to different listing formats
- Amazon S3: Archives historical property data for trend analysis and machine learning
- Redis: Caches frequently accessed data to reduce database load and improve response times
5. Security and Compliance
We prioritize data security and regulatory compliance throughout our system.
- End-to-end encryption: Protects user data during transmission and storage
- GDPR and CCPA compliance: Built-in processes for data privacy regulation adherence
- Role-based access control: Limits data access based on user subscription level and permissions
- Regular security audits: Conducted by third-party specialists to identify and address vulnerabilities
6. Scalability and Performance
Our architecture is designed to grow with our user base without performance degradation.
- Auto-scaling infrastructure: Automatically adjusts computing resources based on current demand
- Content delivery network: Distributes static content globally for faster access
- Database sharding: Partitions data geographically to optimize for local market queries
- Caching strategy: Implements multi-level caching to minimize database calls and improve response times
6. Business Model
6.1 Revenue Model
RealDeal Finder employs a subscription-based revenue model with tiered pricing to serve different segments of the real estate investment market:
Subscription-Based SaaS Model
Our service operates on a subscription basis, providing continuous access to undervalued property alerts and analytics. This model creates predictable recurring revenue while allowing customers to benefit from ongoing improvements to our algorithms and data coverage.
Pricing Structure:
- Starter Plan: $29/month
- Access to basic property alerts in one selected market
- Up to 20 alerts per month
- Basic analytics dashboard
- Ideal for first-time investors or individual buyers looking in a specific area
- Pro Plan: $99/month
- Alerts across up to 3 markets/cities
- Unlimited daily alerts
- Advanced analytics including ROI projections
- One-click agent connection feature
- Targeted at active individual investors managing multiple properties
- Agency Plan: $299/month
- Access to unlimited markets nationwide
- Priority alerts (receive notifications before other tiers)
- Full analytics suite with exportable reports
- White-label alert emails for client sharing
- Designed for real estate agencies and professional investment firms
- Enterprise Plan: Custom pricing
- Custom alert parameters and filtering options
- API access for integration with internal systems
- Dedicated account manager and support
- Onboarding and training sessions
- Tailored for large investment firms, iBuyers, and property portfolio managers
Additional Revenue Streams:
- Referral fees from partner agents: 25% commission share from transactions initiated through our platform
- Premium data reports: One-time purchases of specialized market analysis reports ($49-$199)
- API access for third-party applications: Usage-based pricing for developers building on our platform
This revenue model provides sustainable growth through predictable monthly recurring revenue, while the tiered approach allows us to capture value from both individual investors and larger organizations. The high margins typical of SaaS businesses (70-80%) will enable rapid reinvestment in product development and market expansion.
6.2 Sales Strategy
RealDeal Finder will utilize multiple sales channels and approaches to reach our target market effectively:
1. Self-Service (Digital Acquisition)
- Channel description: Online signup flow allowing customers to register, select a plan, and begin using the service immediately
- Target customers: Individual investors, small-scale property buyers, and tech-savvy real estate professionals
- Conversion strategy: Free 7-day trial with limited alerts, followed by seamless upgrade process to paid subscription
- Projected share: 70% of total customer acquisition in the first year
2. Strategic Partnerships
- Channel description: Collaboration with real estate education platforms, investment groups, and property management companies
- Key partners: BiggerPockets, real estate investment associations, property management software providers
- Revenue sharing: 20% commission for partner-referred customers for the first year of subscription
- Projected share: 20% of total customer acquisition in the first year
3. Enterprise Sales
- Channel description: Direct outreach to larger real estate agencies, investment funds, and property portfolio managers
- Sales cycle: Typically 1-3 months from initial contact to closed deal, including custom demos and trial periods
- Core strategy: Value-based selling focused on ROI and time savings, with custom implementation support
- Projected share: 10% of total customer acquisition but representing 30% of revenue in the first year
Initially, we will focus on the self-service channel to establish product-market fit with minimal overhead. As we validate our value proposition, we’ll expand our partnership program to accelerate growth. The enterprise channel will be developed in parallel but with selective targeting to minimize sales cycle length while maximizing contract value.
6.3 Cost Structure
RealDeal Finder’s primary cost structure consists of the following elements:
Fixed Costs:
- Personnel costs: Monthly $42,000 (4 developers, 1 data scientist, 2 customer support, 1 marketing specialist)
- Technical infrastructure: Monthly $8,500 (AWS hosting, database services, CDN, monitoring tools)
- Office and administrative: Monthly $5,000 (virtual office, accounting, legal, insurance)
- Software subscriptions: Monthly $3,000 (development tools, marketing platforms, customer support system)
- Professional services: Monthly $2,500 (legal compliance, accounting, security audits)
- Total monthly fixed costs: Approximately $61,000
Variable Costs:
- Data acquisition costs: Varies based on volume of properties processed ($0.001-$0.005 per property record)
- Payment processing fees: 2.9% + $0.30 per transaction for subscription payments
- Customer acquisition costs: Initially $200-300 per customer, targeting reduction to $100-150 within 12 months
- Server scaling costs: Increases with user base and data processing volume (estimated 15% growth for each 1,000 new users)
Cost Optimization Strategies:
- Algorithmic efficiency improvements: Reducing computing costs by optimizing data processing routines and implementing smarter filtering
- Regional data caching: Minimizing redundant data collection by implementing geographic-specific update schedules
- Annual subscription incentives: Encouraging annual payments to reduce payment processing fees and improve cash flow
As we scale, we expect to achieve significant economies of scale in data processing, reducing our per-customer cost basis by approximately 40% when reaching 10,000 subscribers. This cost advantage will allow us to either increase margins or invest in additional features while maintaining competitive pricing.
6.4 Profitability Metrics

The following key financial metrics will be used to measure RealDeal Finder’s performance:
Key Financial Metrics:
- Unit Economics: Targeting 3-year customer lifetime value to customer acquisition cost ratio of 4:1
- Customer Lifetime Value (LTV): Calculated as average monthly subscription value × gross margin × average subscription duration; targeting $800-1,200 per customer
- Customer Acquisition Cost (CAC): Total sales and marketing expenses divided by new customers acquired; targeting under $200
- LTV/CAC Ratio: Aiming for 3:1 minimum, with 4:1 as the ideal target to support sustainable growth
- Monthly Recurring Revenue (MRR): Targeting 15% month-over-month growth in first year, stabilizing to 8-10% in year two
- Total Contract Value (TCV): Sum of all active subscription commitments; expected to reach $2M by end of year one
- Break-even Point: Projected at 1,200 paying subscribers (mix of different tiers), expected in month 14
Key Business Metrics:
- Conversion Rate: Free trial to paid subscription goal of 20%; landing page to free trial signup goal of 5%
- Churn Rate: Monthly customer cancellations divided by total customers; targeting under 5% monthly
- Upsell Rate: Percentage of customers upgrading to higher tiers; targeting 15% annually
- Average Usage: Alert open rates > 60%, property detail view rate > 30%, agent connection rate > 5%
- Expansion Revenue: Revenue growth from existing customers (through plan upgrades); targeting 15% annual expansion
These metrics will be tracked through our integrated analytics dashboard with weekly reviews by the management team. Monthly deep-dive analyses will be conducted to identify improvement opportunities, with quarterly strategic adjustments based on trends. Our financial modeling indicates that maintaining these metrics will result in a cash-flow positive operation within 14-16 months.
7. Marketing and Go-to-Market Strategy
7.1 Initial Customer Acquisition Strategy
RealDeal Finder will implement the following strategies to acquire initial customers:
Content Marketing:
- Educational blog series: Weekly articles on identifying undervalued properties, investment strategies, and market trend analysis distributed through real estate forums and social media
- Investment case studies: Monthly detailed analyses of successful deals found through our platform, highlighting ROI and time saved, featured on BiggerPockets and REI forums
- Video tutorials: Bi-weekly YouTube videos demonstrating platform features and real-world applications, optimized for search visibility
- Free market reports: Quarterly downloadable reports on regional real estate trends requiring email signup, creating a lead generation funnel
Digital Marketing:
- SEO: Targeting keywords like “undervalued real estate,” “distressed property alerts,” and “real estate deals finder” with a content-driven approach to organic search visibility
- SEM/PPC: Google Ads campaign with $5,000 monthly budget targeting high-intent searches related to real estate investing, distressed properties, and market analysis
- Social Media: Focused presence on LinkedIn, Facebook investor groups, and Instagram with platform-specific content strategies emphasizing visual deal examples
- Email Marketing: Nurture sequence for trial users with educational content, user success stories, and progressive feature introduction
Community and Relationship Building:
- Real estate investor forum participation: Active engagement in BiggerPockets, Reddit’s real estate investment communities, and local REIA Facebook groups
- Webinar series: Monthly live sessions featuring platform demonstrations and guest experts discussing market opportunities
- Virtual meetups: Bi-monthly online networking events connecting investors with similar market interests
Partnerships and Affiliations:
- Real estate educator partnerships: Collaborations with established educators offering our platform as a recommended tool for their students
- Investor group deals: Special group rates for established real estate investment clubs and associations
- Agent referral program: Commission-sharing structure for real estate agents who refer clients to our platform
- Integration partnerships: Technical integrations with complementary real estate software platforms to expand reach
These strategies will be implemented in a phased approach, beginning with content marketing and community building in months 1-3, followed by increased digital marketing spend in months 4-6, and partnership development beginning in month 3 but with greater emphasis in months 6-12.
7.2 Low-Budget Marketing Tactics
To maximize efficiency with a limited initial marketing budget, we will implement these cost-effective strategies:
Growth Hacking Approach:
- Viral referral program: Offering one month free for every paying customer referred, with additional incentives for referrals that convert to annual plans
- Free alert teaser campaign: Providing one free high-value property alert per week to email subscribers, demonstrating value while encouraging conversion to paid access
- Strategic FOMO tactics: Showcasing time-limited deals that were available exclusively to paid subscribers, highlighting missed opportunities for free users
- Success story spotlights: Featuring users who secured significant deals through the platform, calculating and prominently displaying their ROI
- Limited-time market access: Rotating free access to premium markets on a weekly basis, allowing users to experience full functionality in different regions
Community-Centered Strategies:
- Deal analysis threads: Creating weekly threads in investment forums where our team analyzes potential deals, subtly demonstrating the value our automated system provides
- Local market expert program: Recruiting experienced investors in key markets to serve as brand ambassadors in exchange for free access
- User-generated content campaign: Encouraging customers to share their success stories for feature highlights and subscription credits
- Virtual property tours: Partnering with local agents to provide virtual tours of highlighted properties, building an audience while showcasing our value proposition
Strategic Free Offerings:
- Free market report generator: Creating a simplified tool that generates basic market insights, demonstrating our data capabilities while collecting leads
- Deal analyzer calculator: Offering a free web-based calculator for evaluating property investments, capturing emails and introducing users to our methodology
- Limited regional beta test: Providing full access to early adopters in selected test markets in exchange for detailed feedback and testimonials
These low-budget tactics will be implemented within a monthly marketing budget of $3,000-5,000 during the first six months. We expect these approaches to generate an ROI of 2-3x, with success metrics including cost per lead under $10 and cost per acquisition under $100 during this initial phase.
7.3 Performance Measurement KPIs
RealDeal Finder will track the following KPIs to measure marketing and customer acquisition performance:
Marketing Efficiency Metrics:
- Cost Per Lead (CPL): Target of $8-15 per qualified lead, measured by channel with weekly optimization reviews
- Customer Acquisition Cost (CAC): Target of $150-200 initially, with planned reduction to $100-150 by month 12 through conversion optimization
- Marketing ROI: Target of 300%+ return on marketing spend, calculated by attributing customer lifetime value to specific acquisition channels
- Channel Efficiency: Conversion rates and costs analyzed by acquisition source to optimize channel mix, reviewed bi-weekly
- Landing Page Conversion Rate: Target of 5%+ for visitor-to-trial conversion, tested continuously through A/B experiments
Product Engagement Metrics:
- Trial Activation Rate: Percentage of free trial users who view at least 5 property alerts; target of 70%
- Feature Adoption: Tracking usage of key features like alert customization, agent connection, and analytics tools; targeting 60% adoption
- Time to Value: Measuring how quickly new users find their first valuable property alert; target of under 48 hours
- Session Frequency: Average number of platform visits per week; target of 3+ for active users
- Notification Engagement: Open and click-through rates for deal alerts; targets of 60% and 25% respectively
Financial Performance Metrics:
- Conversion Rate: Target of 20% from free trial to paid subscription, with sub-segmentation by acquisition channel and user behavior
- Average Revenue Per User (ARPU): Initial target of $75 monthly, with growth to $95 through tier upgrades and reduced discounting
- Monthly Recurring Revenue (MRR) Growth: Target of 15%+ month-over-month growth in first year
- Retention Rate: Target of 92%+ monthly retention (8% or lower churn), measured by cohort
- Lifetime Value (LTV): Target of $800+ per customer, with improvements through retention and upselling initiatives
These KPIs will be measured through an integrated analytics system combining data from our marketing platforms, website analytics, application usage metrics, and financial systems. Weekly reports will drive tactical adjustments, while monthly deep-dives will inform strategic shifts in our marketing approach.
7.4 Customer Retention Strategy
To maximize customer satisfaction and build long-term relationships, RealDeal Finder will implement these retention strategies:
Product-Centric Retention Strategies:
- Personalized alert refinement: Automatically adjusting alert parameters based on user engagement patterns to improve alert relevance and value
- Value tracking dashboard: Showing users the estimated total value of deals they’ve received, highlighting potential savings/earnings
- Feature progression: Gradually introducing advanced features through an onboarding sequence to prevent overwhelming new users
- Regular platform enhancements: Implementing monthly feature improvements based on user feedback and usage analytics
Education and Value Delivery:
- Market insight newsletters: Weekly customized market analysis for each user’s selected regions, providing additional value beyond alerts
- Investment strategy webinars: Monthly live sessions with real estate experts providing complementary knowledge
- Deal analysis guides: Customized content helping users evaluate specific types of properties in their target markets
- ROI calculators and tools: Continually expanding suite of analytical tools to support investment decision-making
Community and Relationship Building:
- Exclusive member forums: Private community where subscribers can discuss deals, share experiences, and network
- Success spotlights: Regular features highlighting subscriber success stories, creating aspiration and community recognition
- Market expert connections: Facilitated introductions to experienced investors in specific markets
- Personalized check-ins: Scheduled outreach from customer success team at 30, 90, and 180 days to ensure platform value realization
Incentives and Rewards:
- Loyalty tier upgrades: Automatic feature unlocks and benefits based on subscription longevity
- Annual subscription discounts: 20% savings for annual payment commitment to reduce regular churn decision points
- Referral bonuses: Service credits and premium features for successful referrals
- Win-back campaigns: Specialized offers and product improvements for recently churned customers
Through these retention strategies, we aim to reduce monthly churn from an industry average of 5-7% to under 4%, resulting in an increase in average customer lifetime from 16 months to 25+ months. This extended customer lifecycle will directly improve our LTV/CAC ratio from approximately 3:1 to over 4:1, significantly enhancing overall business profitability.
8. Operational Plan
8.1 Required Personnel and Roles
The following team structure will be necessary for the successful operation and growth of DealFinder:
Initial Startup Team (Pre-launch):
- Technical Co-founder/CTO: Responsible for architecture design, data scraping systems, and analysis algorithms. Required skills in real estate data modeling, Python, and cloud infrastructure. Hire immediately.
- Full-stack Developer: Responsible for building the frontend and backend of the platform. Required skills in React, Node.js, and API development. Hire within first 2 months.
- Data Scientist: Responsible for developing price prediction models and analytics. Required skills in machine learning, statistics, and real estate pricing analysis. Hire within first 3 months.
- Business Co-founder/CEO: Responsible for business development, fundraising, and overall strategy. Required experience in SaaS, real estate market, and startup operations. Founding member.
Personnel Needed Within First Year:
- Customer Success Manager: Responsible for onboarding real estate agencies and supporting enterprise clients. Hire at month 4.
- Sales Representative: Responsible for B2B sales to real estate agencies and brokerages. Hire at month 5.
- Digital Marketing Specialist: Responsible for acquisition and retention campaigns. Hire at month 6.
- UX/UI Designer: Responsible for optimizing user experience and interface design. Hire at month 7.
- Backend Developer: Additional support for scaling the data processing infrastructure. Hire at month 9.
- Content Specialist: Responsible for creating education materials about distressed property investments. Hire at month 10.
Year 2 Additional Personnel:
- Account Executives (2): Responsible for expanding enterprise client base across different regions.
- Data Engineers (2): Responsible for scaling data infrastructure as coverage expands to more regions.
- Product Manager: Responsible for feature roadmap and product development cycles.
- Customer Support Representatives (2): Responsible for handling growing support tickets and customer inquiries.
- Operations Manager: Responsible for optimizing internal processes and team productivity.
Hiring decisions will be tied to specific growth metrics, including monthly recurring revenue milestones, user growth rates, and geographical expansion. We’ll prioritize technical hires early to ensure product stability before scaling sales and marketing operations.
8.2 Key Partners and Suppliers
DealFinder will establish the following partnerships and collaborative relationships for effective operation:
Technology Partners:
- Cloud Infrastructure Providers: AWS or Google Cloud for reliable, scalable hosting with data processing capabilities. Potential special startup programs for cost savings.
- Data Enrichment Services: Property data providers like CoreLogic, Zillow API, or Redfin to supplement our scraped data with additional property insights.
- Real Estate CRM Systems: Integration partners like Salesforce Real Estate Cloud or Propertybase to allow seamless workflow for our agency clients.
- Payment Processing Services: Stripe or similar for handling subscription billing and payment processing.
Channel Partners:
- Real Estate Brokerages: Mid to large-sized brokerages that can promote our service to their agents with revenue-sharing incentives.
- Investor Groups and Networks: Real estate investment clubs, forums, and communities that can provide access to potential power users.
- Real Estate Tech Platforms: Complementary tools that serve similar client bases but don’t directly compete with our value proposition.
Content and Data Partners:
- Property Valuation Services: Partners providing automated valuation models to strengthen our market value analysis.
- Market Research Firms: Partners providing economic and real estate trend data to enhance our predictive capabilities.
- Real Estate Publications: Industry publications and blogs for content distribution and awareness building.
Strategic Alliances:
- Real Estate Education Providers: Organizations teaching property investment to access potential customers and add credibility.
- Mortgage Lenders: Financial institutions specializing in investment properties to offer pre-qualified leads and special rates.
- Title Companies: Service providers that can offer preferred rates to our users for completing transactions.
Partnership development will be phased, focusing first on data and technology partners to ensure product quality, followed by channel partners once we’ve validated our offering. We’ll build partnerships through industry events, direct outreach, and by leveraging investor connections.
8.3 Core Processes and Operational Structure
The following core processes and operational structure will ensure smooth operation of DealFinder:
Product Development Process:
- Weekly Sprints: Agile development cycles with weekly releases, managed by CTO, delivering incremental improvements based on user feedback.
- Monthly Feature Planning: Cross-functional planning involving product, engineering, and customer success teams to prioritize roadmap items.
- Quarterly Strategic Reviews: Deep evaluation of product direction based on user data and market trends, resulting in updated roadmap.
- Data Quality Assurance: Daily automated testing of data accuracy and alerts system for any anomalies, managed by data engineers.
Customer Acquisition and Onboarding:
- Lead Generation: Content marketing, SEO, and targeted paid campaigns managed by marketing team, continuously optimized for CAC efficiency.
- Sales Process: For agency clients, consultative sales approach with demos and custom implementation plans, 2-3 week cycle.
- User Onboarding: Automated onboarding flow for individual users, guided setup for agencies with dedicated success manager.
- Activation Tracking: Monitoring key activation metrics during first 14 days, with intervention protocols for users showing low engagement.
- Feedback Collection: Structured collection of onboarding experience feedback to continually refine the process.
Customer Support Process:
- Tiered Support System: Level 1 for basic inquiries, Level 2 for technical issues, Level 3 for complex data questions.
- Support Channels: Email, live chat during business hours, and scheduled calls for premium clients.
- SLA Commitments: Response time guarantees based on subscription tier, with escalation procedures for missed targets.
- Knowledge Base Management: Regular updates to self-service help materials based on common support tickets.
Data and Insights Process:
- Data Collection: Automated daily scraping of real estate platforms at optimized times, managed by data engineering team.
- Data Processing: Real-time analysis of price changes and market conditions using proprietary algorithms.
- Alert Generation: Automated system for identifying and delivering deal alerts based on user preferences.
- Reporting: Weekly data quality reports, monthly market trend analysis, and quarterly predictive model refinement.
These processes will be managed using tools like Jira for development, HubSpot for sales and marketing, Zendesk for support, and custom dashboards for operational metrics. We’ll implement continuous improvement cycles with monthly process reviews based on key performance indicators.
8.4 Scalability Plan
The following plan outlines how DealFinder will scale its operations as the business grows:
Geographic Expansion:
- Months 1-6: Focus on 3-5 major metropolitan areas with high real estate turnover (NYC, LA, Chicago, Miami, Dallas), establishing data quality and user base.
- Months 7-12: Expand to 10 additional mid-sized markets with active investor communities, leveraging established processes with regional customization.
- Months 13-18: Coverage of top 50 US metropolitan areas, requiring additional data engineering capacity and regional market specialists.
- Months 19-24: Complete nationwide coverage of all major real estate markets, potentially exploring Canadian markets for international expansion.
Product Expansion:
- Months 1-6: Core deal-finding functionality with basic filtering and alerts.
- Months 7-12: Advanced analytics features, including ROI calculators and renovation cost estimators.
- Months 13-18: Integration with financing partners, transaction management tools, and comprehensive portfolio tracking.
- Months 19-24: Mobile app development with location-based features and enhanced notifications.
- Months 25-36: Machine learning-driven deal recommendations and predictive market analytics.
Market Segment Expansion:
- Months 1-6: Individual real estate investors looking for immediate deals, using direct digital marketing and content strategy.
- Months 7-18: Small to mid-sized real estate agencies serving investors, with dedicated sales team and agency-specific features.
- Months 19-30: Institutional investors and larger brokerages, requiring enterprise features and customized data solutions.
Team Expansion Plan:
- Technical Team: Growing from 3 to 10+ specialists over 24 months, with emphasis on data engineering and machine learning talent.
- Sales & Marketing: Scaling from 2 to 8+ team members, transitioning from digital-only to including field sales for enterprise clients.
- Customer Success: Expanding from 1 to 5+ representatives as user base grows, with specialized roles for different customer segments.
- Product & Design: Growing from 1 to 4+ specialists, including dedicated mobile experience experts in year two.
This expansion plan will be guided by specific metrics including customer acquisition costs, monthly recurring revenue growth, and customer lifetime value. We’ll prioritize regions showing strongest unit economics and adjust the timeline based on available capital and market conditions.
9. Financial Plan
9.1 Initial Investment Requirements
The following investment will be required to launch and initially operate DealFinder:
Development Costs:
- Platform Development: $120,000 (Initial MVP with core scraping and alert functionality)
- Data Architecture Setup: $45,000 (Cloud infrastructure, database design, data pipeline)
- Algorithm Development: $60,000 (Price analysis, market value comparison, anomaly detection)
- UI/UX Design: $35,000 (User interface design, user experience testing)
- QA and Testing: $25,000 (Data accuracy validation, platform testing, security audits)
- Development Costs Total: $285,000
Initial Operating Costs:
- Legal Setup: $15,000 (Company formation, terms of service, data usage policies)
- Cloud Infrastructure: $7,500 (6 months of server costs, data storage, processing power)
- Licenses and Software: $12,000 (Development tools, third-party APIs, SaaS subscriptions)
- Office/Remote Setup: $10,000 (Workspace, equipment, collaboration tools)
- Team Salaries: $180,000 (6 months for core team of 4 before revenue)
- Initial Operating Costs Total: $224,500
Marketing and Customer Acquisition Costs:
- Brand Development: $20,000 (Logo, identity, website, messaging strategy)
- Content Creation: $30,000 (Blog posts, videos, educational materials, case studies)
- Digital Marketing: $45,000 (SEO, paid acquisition for first 6 months)
- Launch Campaign: $25,000 (PR, events, partnerships, launch promotions)
- Marketing Costs Total: $120,000
Total Initial Investment Required: $629,500
This initial investment is designed to support operations for approximately 9 months, allowing for 6 months of development and 3 months of initial market operations. The budget assumes lean startup methodology with focus on proven real estate markets first before expansion. Cost assumptions are based on US market rates for technical talent and cloud services with appropriate buffers for contingencies.
9.2 Monthly Profit and Loss Projections
The following represents projected profit and loss for the first 12 months after launch:
Revenue Projections:
- Months 1-3: $10,000-25,000 monthly (100-250 individual subscribers at $99/month, 2-5 agency clients at $499/month)
- Months 4-6: $30,000-60,000 monthly (250-450 individual subscribers, 8-15 agency clients)
- Months 7-9: $70,000-120,000 monthly (500-800 individual subscribers, 20-35 agency clients)
- Months 10-12: $150,000-200,000 monthly (1,000-1,200 individual subscribers, 40-60 agency clients)
- Projected Monthly Revenue at End of Year 1: $200,000 (1,200 individual subscribers at $99, 60 agency clients at average $1,000)
Expense Projections:
- Months 1-3: $80,000-90,000 monthly (Core team salaries, infrastructure, marketing ramp-up)
- Months 4-6: $100,000-120,000 monthly (Team expansion, increased marketing, scaling infrastructure)
- Months 7-9: $130,000-150,000 monthly (Additional hires, geographical expansion costs, increased customer support)
- Months 10-12: $160,000-180,000 monthly (Further team growth, enterprise sales team, advanced feature development)
- Projected Monthly Expenses at End of Year 1: $180,000 (Personnel 70%, Technology 15%, Marketing 10%, Operations 5%)
Monthly Cash Flow:
- Months 1-3: $55,000-70,000 monthly deficit
- Months 4-6: $40,000-70,000 monthly deficit
- Months 7-9: $30,000-60,000 monthly deficit
- Months 10-12: $10,000-30,000 monthly deficit, approaching break-even by month 12
- Maximum Cumulative Deficit: Approximately $500,000
These projections are based on moderate-case scenarios with conversion rates from marketing activities at industry averages. We assume a 15% monthly growth rate in individual subscribers and 20% in agency clients, with churn rates of 5% and 3% respectively. Our financial model indicates path to profitability by month 14-15, with significant revenue acceleration in the second year as network effects and reputation strengthen our market position.
9.3 Break-even Analysis
DealFinder’s break-even analysis is as follows:
Break-even Point Timing:
- Expected Timing: 14-15 months after launch
- Required Paying Customers: Approximately 1,400 individual subscribers and 70 agency clients
- Monthly Fixed Costs Base: $180,000
- Average Revenue Per User (ARPU): $99 for individuals, $1,200 for agencies
- Average Variable Cost Per User: $12 (support, infrastructure, data processing)
- Break-even Monthly Revenue: $205,000
Post-Break-even Projections:
- Months 15-18: Monthly net profit $20,000-$50,000
- Months 19-24: Monthly net profit $60,000-$150,000
- Months 25-36: Monthly net profit $200,000-$400,000
- Projected Monthly Growth Rate Post-Break-even: 12-15%
Profitability Improvement Plan:
- Months 12-18: Increase agency ARPU by 30% through enterprise tier features and add-on services
- Months 18-24: Reduce CAC by 25% through referral programs and improved targeting
- Months 24-36: Increase margin by establishing direct data partnerships and optimizing infrastructure costs
This break-even analysis is based on conservative revenue growth projections and includes provisions for unexpected expenses. The most sensitive variables are customer acquisition costs and churn rates – a 20% improvement in either metric could accelerate break-even by 2-3 months. We will closely monitor unit economics, particularly CAC:LTV ratio, targeting a minimum 3:1 ratio before significantly scaling marketing spend.
9.4 Funding Strategy
DealFinder’s funding strategy across growth stages is as follows:
Initial Stage (Pre-seed):
- Target Amount: $250,000
- Sources: Founder investment, angel investors with real estate technology experience, family offices with real estate holdings
- Use of Funds: MVP development, initial data architecture, legal setup
- Timing: Immediate (before development starts)
Seed Round:
- Target Amount: $750,000-$1,000,000
- Target Investors: Real estate technology-focused seed funds, angel syndicates, strategic investors from brokerage or proptech sectors
- Valuation Target: $4-6 million (pre-money)
- Timing: 3-4 months post-launch
- Use of Funds: Team expansion, marketing acceleration, geographic coverage expansion
- Key Milestones to Achieve: 500+ paying users, demonstrated product-market fit, 40%+ monthly growth rate
Series A:
- Target Amount: $3-5 million
- Target Investors: Venture capital firms with real estate or B2B SaaS focus, strategic real estate data companies
- Valuation Target: $15-25 million (pre-money)
- Timing: 18-24 months post-launch
- Use of Funds: National expansion, advanced feature development, enterprise sales team build-out
- Key Milestones to Achieve: $2.5M+ ARR, unit economics showing 4:1 LTV:CAC, 30%+ market coverage
Alternative Funding Strategies:
- Revenue-Based Financing: Consider for scaling marketing with proven CAC:LTV after 12 months
- Strategic Partnership: Potential investment from major real estate platforms or data providers
- SBA Loans: Consider for specific expansion initiatives once revenue stability is achieved
- Convertible Notes Bridge: Between equity rounds if additional runway needed
This funding strategy will be adjusted based on actual growth metrics and market conditions. We plan to maintain at least 6 months of runway at all times and will closely monitor burn rate relative to growth. In favorable market conditions with strong traction, we may accelerate the Series A timeline, while in more challenging environments we’ll focus on extending runway and path to profitability.
10. Implementation Roadmap
10.1 Key Milestones
The following key milestones outline DealFinder’s development and growth plan:
Pre-launch (Months 1-6):
- Months 1-2: Complete team assembly, finalize platform architecture, establish data sources and scraping methodology
- Months 2-3: Develop core algorithms for price analysis and anomaly detection, begin UI design
- Months 3-4: Build MVP with basic functionality, test with internal data sets from 3 target markets
- Months 4-5: Beta testing with 50-100 selected users, refine platform based on feedback
- Months 5-6: Finalize pricing model, prepare marketing assets, establish customer support processes
First 3 Months Post-Launch (Months 7-9):
- Achieve 250+ Individual Subscribers: Execute launch marketing plan with content strategy and targeted ads to real estate investor communities
- Secure 5+ Agency Clients: Conduct direct outreach to mid-sized agencies with investor-focused agents
- Expand to 5 Metropolitan Areas: Complete data validation and establish reliable scraping operations in target markets
- Reach 90% Data Accuracy: Implement quality control processes and continuous validation of price predictions
- Release First Major Feature Update: Based on initial user feedback, prioritizing highest impact improvements
Months 10-12 Post-Launch:
- Reach 1,000+ Individual Subscribers: Scale acquisition channels that showed best performance in months 7-9
- Secure 40+ Agency Clients: Establish sales process with demonstrations and custom onboarding
- Expand to 15 Metropolitan Areas: Focus on markets with highest deal velocity and investor activity
- Implement Agency Dashboard: Build tools for agencies to manage multiple agents and track performance
Year 2 Key Objectives:
- Q1: Launch mobile application, reach 30 metropolitan areas, implement advanced filtering options
- Q2: Integrate with first mortgage partners, reach 2,500+ subscribers, develop portfolio analytics
- Q3: Begin enterprise tier development, expand to 40 metropolitan areas, implement predictive analytics
- Q4: Complete nationwide coverage, reach $4M+ ARR, establish API for third-party integrations
These milestones will be tracked using OKR methodology with weekly progress reviews by the leadership team. We’ve built in buffer time for unexpected challenges and will maintain flexibility to reprioritize based on market feedback and emerging opportunities.
10.2 Launch Strategy
DealFinder’s strategy for successful market entry encompasses the following approach:
MVP (Minimum Viable Product) Phase:
- Core Functionality Definition: Daily data scraping from major platforms, price trend analysis, deal alerts for properties below market value, and basic filtering options – focusing only on essential features that solve the core problem
- Development Timeline: 4 months from start to functional MVP
- Testing Methodology: Internal testing with historical data sets to validate algorithm accuracy in identifying genuine deals
- Success Criteria: 90%+ accuracy in identifying properties at least 15% below market value, system stability with daily updates
Beta Testing Plan:
- Target Audience: 75-100 active real estate investors across 3 test markets with diverse experience levels
- Duration: 6 weeks with weekly feedback cycles
- Incentives: Free lifetime access to basic tier, priority feature requests, early access to premium features
- Testing Objectives: Validate user experience, deal alert quality, feature prioritization, and pricing willingness
- Feedback Collection Methods: Weekly surveys, usage analytics, one-on-one interviews with power users, feature request tracking
Official Launch Strategy:
- Initial Target Markets: New York, Los Angeles, Miami, Dallas, Chicago – selected for high deal volume and active investor communities
- Primary Target Segment: Individual real estate investors with 1-10 properties looking for below-market deals
- Launch Events: Virtual webinar showcasing successful deals found during beta, partnerships with 2-3 real estate investment podcasts
- Promotional Offers: Early adopter pricing (30% discount for first 6 months), referral bonuses, agency team discounts
- PR Strategy: Features in real estate investment blogs, case studies with beta users, targeted outreach to real estate technology publications
Post-Launch Stabilization:
- Monitoring Protocol: Daily data accuracy checks, real-time alert tracking, user engagement metrics, conversion and churn dashboards
- Response System: Dedicated technical team for first 30 days post-launch, escalation process for critical issues, daily stand-up meetings
- Initial Improvement Cycle: Weekly releases for first 8 weeks focused on highest impact user feedback and stability improvements
This launch strategy is built on the principles of rapid iteration and close customer feedback loops. We’ve studied successful proptech launches like Zillow and Redfin to understand effective market entry approaches in the real estate technology space.
10.3 Growth Metrics and Targets
The following key performance indicators and targets will measure DealFinder’s growth:
User Growth:
- Months 1-3: 250+ individual subscribers, 5+ agency clients (25-30% monthly growth)
- Months 4-6: 600+ individual subscribers, 20+ agency clients (20-25% monthly growth)
- Months 7-12: 1,500+ individual subscribers, 70+ agency clients (15-20% monthly growth)
- Year 2: 5,000+ individual subscribers, 200+ agency clients (10-15% monthly growth)
Product Usage:
- Weekly Active Users: Target 80%+ of subscriber base actively using platform weekly, measured through login frequency and alert interactions
- Deal Alert Engagement: Target 60%+ open rate on deal alerts, 25%+ click-through to property details
- Property Views per User: Target 15+ unique property views per active user per week
- Feature Adoption: 70%+ of users utilizing advanced filtering options within first month of subscription
Financial Targets:
- Months 1-6: $250,000 cumulative revenue, primarily from individual subscriptions
- Months 7-12: $1M+ cumulative revenue, with agency subscriptions growing to 40% of total
- Year 2 Q1-Q2: $1.5M+ quarterly revenue, improving gross margins to 80%+
- Year 2 Q3-Q4: $2.5M+ quarterly revenue, with enterprise clients representing 15%+ of revenue
User Satisfaction:
- Net Promoter Score: Target 40+ by month 6, 50+ by end of year 1
- Churn Rate: Target under 5% monthly for individuals, under 3% for agencies
- Deal Success Rate: Target 10%+ of viewed properties resulting in offers from our users
Performance Measurement:
- Weekly Tracking: User acquisition, engagement metrics, alert quality, and technical performance
- Monthly Analysis: Revenue growth, churn patterns, cohort performance, and marketing effectiveness
- Quarterly Review: Unit economics, expansion metrics, feature impact analysis, and competitive positioning
These metrics will be measured using a combination of Mixpanel for user analytics, ChartMogul for subscription metrics, and custom dashboards for business KPIs. Weekly growth meetings will review these metrics with key stakeholders, and we’ll implement a data-driven growth process where underperforming metrics trigger immediate strategy adjustments. We’ve established contingency plans for scenarios where growth is 30% below targets that include revised marketing approaches and product enhancement priorities.
10.4 Risk Analysis and Mitigation Strategies
The following key risks and corresponding mitigation strategies have been identified for DealFinder:
Technical Risks:
- Data Source Reliability:
- Impact: Major real estate platforms blocking our scraping activities could severely disrupt service
- Probability: Medium
- Mitigation Strategy: Develop multiple scraping approaches, establish backup data sources, pursue API partnerships where possible, implement ethical scraping practices with appropriate delays
- Algorithm Accuracy:
- Impact: Poor accuracy in identifying genuine deals would undermine core value proposition
- Probability: Medium
- Mitigation Strategy: Regular algorithm validation against known good deals, continuous refinement based on user feedback, manual verification layer for high-confidence deals
Market Risks:
- Real Estate Market Slowdown:
- Impact: Reduced transaction volume could limit deal availability and investor appetite
- Probability: Medium
- Mitigation Strategy: Diversify across markets with different economic cycles, adapt algorithm to changing market conditions, emphasize value in down markets (greater discounts)
- Competitive Response:
- Impact: Major platforms could launch similar features or block our access
- Probability: Medium-High
- Mitigation Strategy: Build defensible IP around deal identification algorithms, establish strong brand loyalty, create switching costs through saved preferences and history
Operational Risks:
- Scaling Challenges:
- Impact: Inability to maintain service quality as user base grows could damage reputation
- Probability: Medium
- Mitigation Strategy: Implement cloud architecture designed for scalability, establish performance metrics with alerts, phase geographical expansion
- Team Recruitment:
- Impact: Difficulty hiring key technical talent could slow development and expansion
- Probability: Medium
- Mitigation Strategy: Competitive compensation packages, equity incentives, remote work options, partnerships with specialized recruiters
Regulatory and Legal Risks:
- Data Privacy Regulations:
- Impact: Changing regulations regarding data collection could restrict operations
- Probability: Medium
- Mitigation Strategy: Design compliant data policies from start, avoid collecting sensitive personal data, regular legal reviews
- Real Estate Listing Disputes:
- Impact: Legal challenges from listing services regarding our data usage
- Probability: Medium-High
- Mitigation Strategy: Legal review of scraping practices, focus on publicly available data, terms of service clearly distinguishing our service
This risk management plan will be reviewed quarterly by the leadership team and updated as new risks emerge. We have established a rapid response protocol for critical risks, with clear ownership and escalation paths. A contingency fund representing 10% of operating expenses will be maintained to address unforeseen challenges.
Conclusion
DealFinder addresses a significant pain point in the real estate investment market by cutting through the noise of overwhelming property listings to connect motivated sellers with opportunity-seeking buyers. Through our innovative data analytics approach, we enable investors to quickly identify properties trading significantly below market value before competitors.
Our key competitive advantages include proprietary algorithms for market value assessment, real-time identification of urgent sales, seamless integration with real estate agency workflows, and a specialized focus on distressed deals that mainstream platforms don’t prioritize. These advantages position us to become the go-to platform for value investors in real estate.
Financially, we project reaching break-even at month 14-15 with approximately 1,400 individual subscribers and 70 agency clients, generating $205,000 in monthly recurring revenue. These projections are based on conservative growth estimates and verified customer acquisition costs from similar B2B SaaS platforms in the real estate technology sector.
Ultimately, DealFinder will transform how real estate investment opportunities are discovered, making property investment more accessible and efficient. By connecting buyers with high-potential deals that would otherwise be overlooked, we’ll help create value for investors while providing liquidity to sellers needing fast transactions, contributing to a more dynamic and efficient real estate marketplace across the United States.
Disclaimer & Notice
- Information Validity: This Business Plan is based on publicly available information at the time of analysis. Please note that some information may become outdated or inaccurate over time due to changes in the service, market conditions, or business model.
- Data Sources & Analysis Scope: The content of this Business Plan is prepared solely from publicly accessible sources, including official websites, press releases, blogs, user reviews, and industry reports. No confidential or internal data from the company has been used. In some cases, general characteristics of the SaaS industry may have been applied to supplement missing information.
- No Investment or Business Solicitation: This Business Plan is not intended to solicit investment, business participation, or any commercial transaction. It is prepared exclusively for informational and educational purposes to help prospective entrepreneurs, early-stage founders, and startup practitioners understand the SaaS industry and business models.
- Accuracy & Completeness: While every effort has been made to ensure the accuracy and reliability of the information, there is no guarantee that all information is complete, correct, or up to date. The authors disclaim any liability for any direct or indirect loss arising from the use of this report.
- Third-Party Rights: All trademarks, service marks, logos, and brand names mentioned in this Business Plan belong to their respective owners. This report is intended solely for informational purposes and does not infringe upon any third-party rights.
- Restrictions on Redistribution: Unauthorized commercial use, reproduction, or redistribution of this report without prior written consent is prohibited. This Business Plan is intended for personal reference and educational purposes only.
- Subjectivity of Analysis: The analysis and evaluations presented in this Business Plan may include subjective interpretations based on the available information and commonly used SaaS business analysis frameworks. Readers should treat this Business Plan as a reference only and conduct their own additional research and professional consultation when making business or investment decisions.
No comment yet, add your voice below!